| This week | |
|---|---|
| Presentation interface and application programming | http://academy.cba.mit.edu/classes/interface_application_programming/index.html |
| video of the review (output devices) | http://fab.academany.org/2018/lectures/fab-20180411.html |
| video of the lecture | http://fab.academany.org/2018/lectures/fab-20180411.html |
| recitation: xDesign | http://fab.academany.org/2018/lectures/fab-20180423.html |
| Assignment | Used software | Files/Downloads/links |
|---|---|---|
| Group Assignment | compare as many tool options as possible | http://fab.academany.org/2018/labs/fablabamsterdam/interfaces/interfaces.html |
| Python script | python | ldr.py |
| mrtg | mrtg | mrtg.tar.xz |
well, interfaces…. Not my favorite. I spend my days behind the computer mainly in a terminal. Main tools are ssh, vim, wget and specially unix pipes. My experience in programming is little till nothing, although i can interpret a lot of languages.
But anyway: i have written an application with interface.
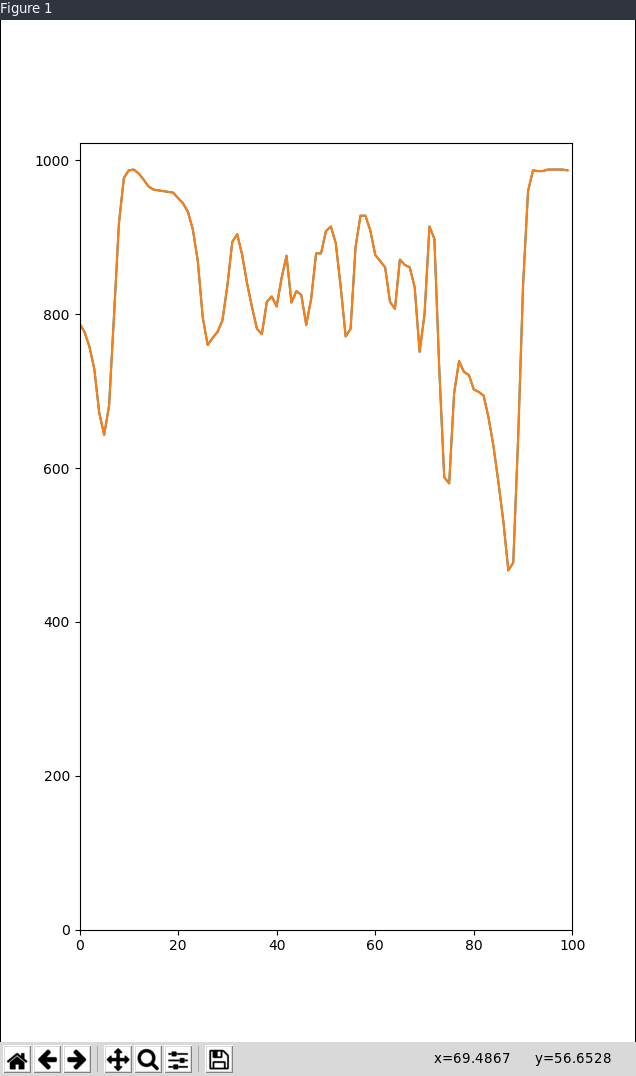
In this interface you can see live data from the phototransistor on my hello world board. I programmed the hello world board to write the output of the sensor to serial.
The python script opens the serial connection and plots a wavetable in the interface.
But first the code for the hello world board:
#include <SoftwareSerial.h>
#define rxPin 0
#define txPin 1


SoftwareSerial serial(rxPin, txPin);

int pin_L_sensor = 2;

int value_L_sensor = 0;

void setup() {
pinMode(rxPin, INPUT);
pinMode(txPin, OUTPUT);
pinMode(pin_L_sensor, INPUT);
serial.begin(9600);
}

void loop(){

value_L_sensor = analogRead(pin_L_sensor);

serial.println(value_L_sensor);

delay(100);
}
Python
Searching the web I encountered matplotlib:
Matplotlib is a Python 2D plotting library which produces publication quality figures in a variety of hardcopy formats and interactive environments across platforms. Matplotlib can be used in Python scripts, the Python and IPython shells, the Jupyter notebook, web application servers, and four graphical user interface toolkits.

Matplotlib tries to make easy things easy and hard things possible. You can generate plots, histograms, power spectra, bar charts, errorcharts, scatterplots, etc., with just a few lines of code.
Sounded usefull :) I used an example i found on the internet, that reads the serial interface and animates that in a chart:
"""
ldr.py
Display analog data from Arduino using Python (matplotlib)
Author: Mahesh Venkitachalam
Website: electronut.in
"""

import serial, argparse
from collections import deque

import matplotlib.pyplot as plt
import matplotlib.animation as animation


# plot class
class AnalogPlot:
  # constr
  def __init__(self, strPort, maxLen):
      # open serial port
      self.ser = serial.Serial(strPort, 9600)

      self.a0Vals = deque([0.0]*maxLen)
      self.a1Vals = deque([0.0]*maxLen)
      self.maxLen = maxLen

  # add data
  def add(self, data):
      assert(len(data) == 2)
      self.addToDeq(self.a0Vals, data[0])
      self.addToDeq(self.a1Vals, data[1])

  # add to deque, pop oldest value
  def addToDeq(self, buf, val):
      buf.pop()
      buf.appendleft(val)

  # update plot
  def update(self, frameNum, a0, a1):
      try:
          line = self.ser.readline()
          data = [float(val) for val in line.split()]
          # print data
          if(len(data) == 2):
              self.add(data)
              a0.set_data(range(self.maxLen), self.a0Vals)
              a1.set_data(range(self.maxLen), self.a1Vals)
      except:
          pass

      return a0, a1

  # clean up
  def close(self):
      # close serial
      self.ser.flush()
      self.ser.close()

# main() function
def main():
  # create parser
  parser = argparse.ArgumentParser(description="LDR serial")
  # add expected arguments
  parser.add_argument('--port', dest='port', required=True)
  parser.add_argument('--N', dest='maxLen', required=False)

  # parse args
  args = parser.parse_args()

  #strPort = '/dev/tty.usbserial-A7006Yqh'
  strPort = args.port

  print('reading from serial port %s...' % strPort)

  # plot parameters
  maxLen = 100
  if args.maxLen:
      maxLen = int(args.maxLen)

  # create plot object
  analogPlot = AnalogPlot(strPort, maxLen)

  print('plotting data...')

  # set up animation
  fig = plt.figure()
  ax = plt.axes(xlim=(0, maxLen), ylim=(0, 1023))
  a0, = ax.plot([], [])
  a1, = ax.plot([], [])

  ax.set_ylabel('Phototransistor output')
  ax.set_xlabel('Time')
  ax.set_title('For Fabacademy 2018 - interface and application programming')

  anim = animation.FuncAnimation(fig, analogPlot.update,
                                 fargs=(a0, a1),
                                 interval=20)

  # show plot
  plt.show()

  # clean up
  analogPlot.close()

  print('exiting.')


# call main
if __name__ == '__main__':
  main()
The first part of the script imports the right libraries:
    import serial, argparse
    from collections import deque

    import matplotlib.pyplot as plt
    import matplotlib.animation as animation
The second part opens the serial port and handling the data, putting it in 2 variables (a0 and a1)
 # plot class
 class AnalogPlot:
    # constr
  def __init__(self, strPort, maxLen):
      # open serial port
      self.ser = serial.Serial(strPort, 9600)

      self.a0Vals = deque([0.0]*maxLen)
      self.a1Vals = deque([0.0]*maxLen)
      self.maxLen = maxLen

  # add data
  def add(self, data):
      assert(len(data) == 2)
      self.addToDeq(self.a0Vals, data[0])
      self.addToDeq(self.a1Vals, data[1])

  # add to deque, pop oldest value
  def addToDeq(self, buf, val):
      buf.pop()
      buf.appendleft(val)

  # update plot
  def update(self, frameNum, a0, a1):
      try:
          line = self.ser.readline()
          data = [float(val) for val in line.split()]
          # print data
          if(len(data) == 2):
              self.add(data)
              a0.set_data(range(self.maxLen), self.a0Vals)
              a1.set_data(range(self.maxLen), self.a1Vals)
      except:
          pass

      return a0, a1

  # clean up
  def close(self):
      # close serial
      self.ser.flush()
      self.ser.close()
Then the main program starts.
- 1st it starts the parser
- 2nd it add the expected arguments
- 3d it parses the arguments and starts reading from serial (str.Port)
- Then it collects the data to be plotted (AnalogPlot(strPort, maxLen)
- The animation is setup
- Then the plot is shown
# main() function
def main():
  # create parser
  parser = argparse.ArgumentParser(description="LDR serial")
  # add expected arguments
  parser.add_argument('--port', dest='port', required=True)
  parser.add_argument('--N', dest='maxLen', required=False)

  # parse args
  args = parser.parse_args()

  #strPort = '/dev/tty.usbserial-A7006Yqh'
  strPort = args.port

  print('reading from serial port %s...' % strPort)

  # plot parameters
  maxLen = 100
  if args.maxLen:
      maxLen = int(args.maxLen)

  # create plot object
  analogPlot = AnalogPlot(strPort, maxLen)

  print('plotting data...')

  # set up animation
  fig = plt.figure()
  ax = plt.axes(xlim=(0, maxLen), ylim=(0, 1023))
  a0, = ax.plot([], [])
  a1, = ax.plot([], [])
  anim = animation.FuncAnimation(fig, analogPlot.update,
                                 fargs=(a0, a1),
                                 interval=20)

  # show plot
  plt.show()

  # clean up
  analogPlot.close()

  print('exiting.')
Handy modifications
-
To save the animation you can pipe the output directly to a mp4 file.
- open the script in vim or another editor
- go to line last line of the animation block (line 93)
- write something like:
anim.save('ldr.mp4', metadata={'artist':'Henk'} - a file named ldr.mp4 will now be saved in the dir where you fired up the script. With metadata :)
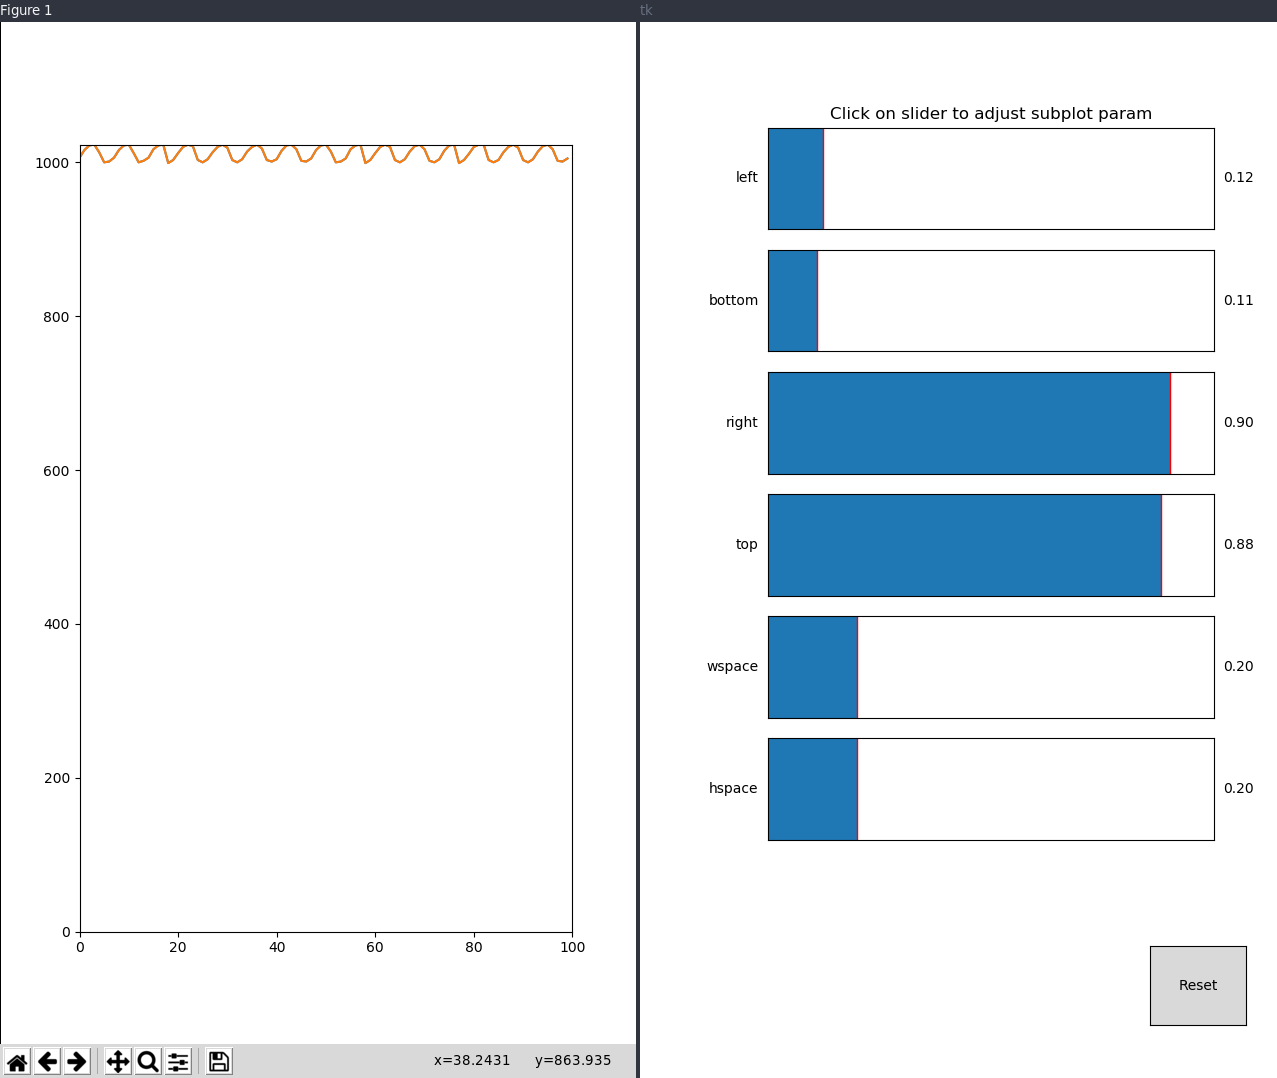
- on the menubar under the animation click on configure subplots, and a new window opens were you can control the environments behavior of the aninmation.
-
the max length on the axes is set with:
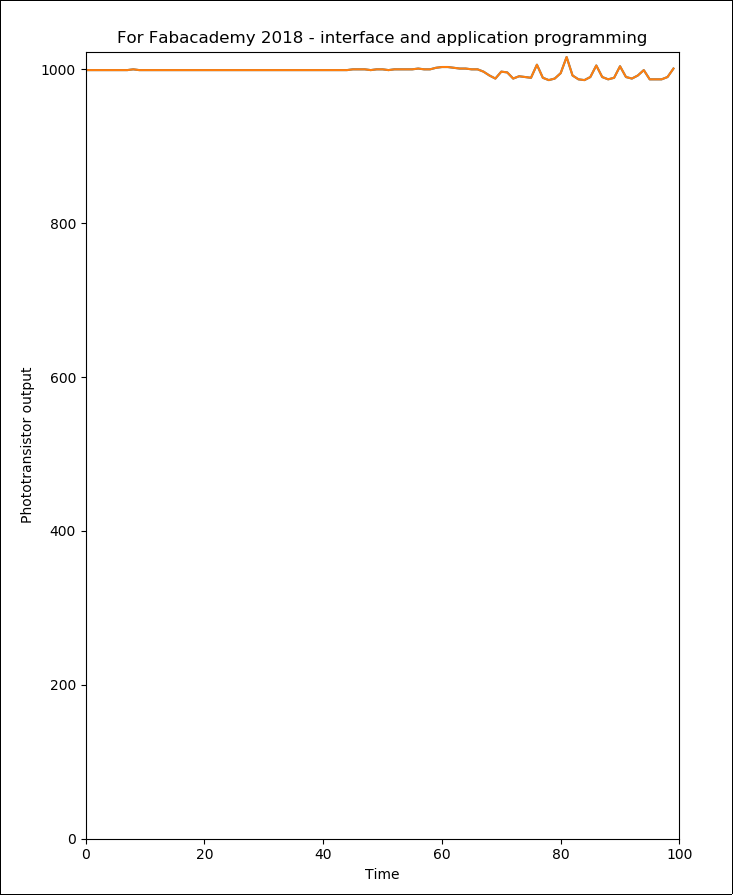
ax = plt.axes(xlim=(0, maxLen), ylim=(0, 1200)) -
Give the plot a name and name the x and y axes:
ax.set_ylabel('LDR output')
ax.set_xlabel('Time')
ax.set_title('For Fabacademy 2018 - interface and application programming')
MRTG
Suddenly remembered that i off course allready did some application and interface programming in the past :)
I modified some file and here is the output (is a website, data is html and generated images):
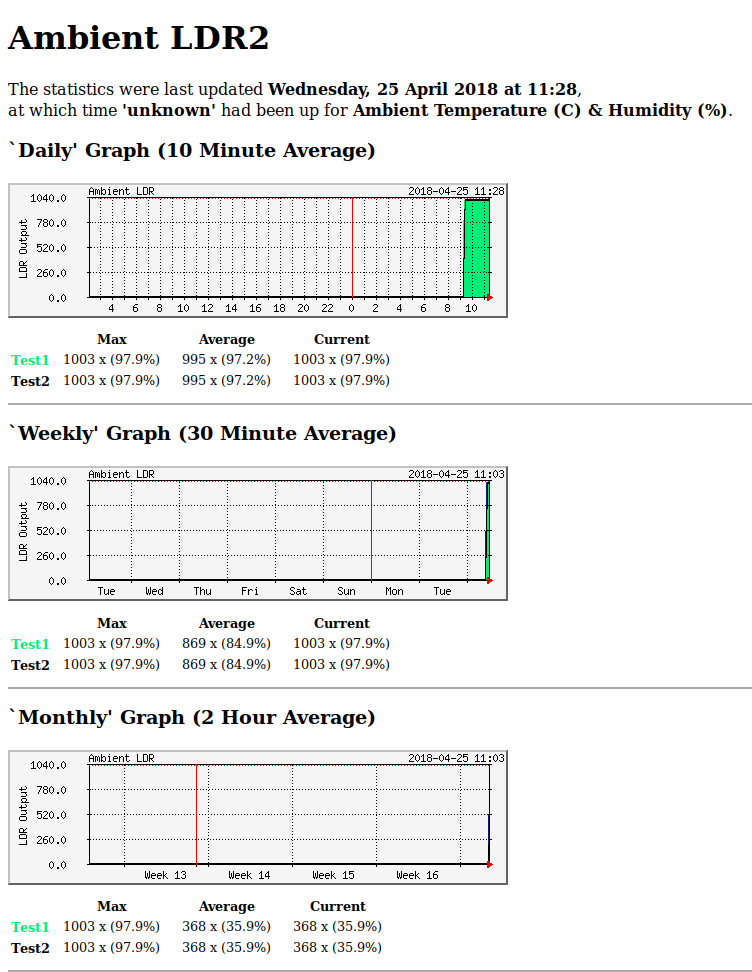
MRTG is an already ancient software for monitoring and measuring the traffic load on network links. It allows the user to see traffic load on a network over time in graphical form. Originally! But you can feed mrtg with all kind of data. So i modified it to read /dev/ttyUSB0 and use the data to feed mrtg. In this case you get a data history of the sensor as shown above. I did it this morning, so there is not much data on it yet.
to get the data from the board a simple command is used:
cat /dev/ttyUSB1 > arduino.dat
I only need the latest line so a short sh script is made to get it:
tail -1 arduino.dat > latestArduino.dat
Get the numbers into variables for mrtg:
#!/bin/sh
# extracts LDR info.

TEMP=`awk '{print int($1+0.5)}' /home/henk/ldr/latestArduino.dat`
RH=`awk '{print int($1+0.5)}' /home/henk/ldr/latestArduino.dat`

LABEL="Ambient LDR"
echo $TEMP
echo $RH
and the this is the mrtg config file for this:
Interval: 10
WorkDir: /home/henk/ldr

Target[ambient]: `./ambient.sh`
Options[ambient]: growright,integer,gauge,pngdate
Colours[ambient]: springgreen#00ee76,color2#000000,Color3#121212,Color4#191970
MaxBytes[ambient]: 1024
AbsMax[ambient]: 1024
WithPeak[ambient]: ymw
UnScaled[ambient]: ymwd
YLegend[ambient]: LDR Output
ShortLegend[ambient]: x
Legend1[ambient]: T
LegendI[ambient]: Test1
LegendO[ambient]: Test2
PNGTitle[ambient]: Ambient LDR
Title[ambient]: Ambient LDR1
PageTop[ambient]: <h1>Ambient LDR2</h1>
the crontab then every 10 minutes executes the script and updates MRTG
*/1 * * * * root cd /home/henk/ldr && env LANG=C /usr/bin/mrtg arduino.cfg