Week 13 - Interface and applications programming
Group assignment
compare as many tool options as possible
Here is a link to our lab's page which includes links to all our group assignments.
Individual assignment
write an application that interfaces with an input and/or output device that you made
Assignment summary
what I achieved/learned this week:
- wrote applications in Processing to send tabulated data to + receive temperature data from my board through the serial interface
- wrote an application in Python to read and plot the temperature data that was being sent from my board
- spent ages with lots of various bits of code...this was a very progressive week!
Introduction
I was a bit flumoxed with this week early doors, but I think I now have a way forward that might just work. At first I wasn't sure where to start, what software would do the job I needed? how to get things to talk to each other? how would I learn the relevant language...would I need code or could I use a front-end development tool like Azande, or Jubito.
Ideally I don't want to do this, so I thought I'd do some more digging and have found a way to get Applications to talk to the board ((this tutorial was an amazing start!), by writing an initial programme in Arduino IDE and uploading this to the board. This then opens up the lines of communication with the Processing programme, so it is ready to receive the data from Processing. In this case the Processing programme was simply setup to read the digital input from a mouse click (1=on, 0=off), but in future this could be quite a sophisticated graphical user interface (GUI). So, here's the arduino sketch I uploaded to my board. I also tried this with a generic Arduino Uno and it worked there also.
 char val; // Data received from the serial port
 int ledPin = 13; // Set the pin to digital I/O 13

 void setup() {
   pinMode(ledPin, OUTPUT); // Set pin as OUTPUT
   Serial.begin(9600); // Start serial communication at 9600 bps
 }

 void loop() {
   if (Serial.available())
   { // If data is available to read,
     val = Serial.read(); // read it and store it in val
   }
   if (val == '1')
   { // If 1 was received
      Serial.println("LED ON");
     digitalWrite(ledPin, HIGH); // turn the LED on
   } else {
     digitalWrite(ledPin, LOW); // otherwise turn it off
   }
   delay(10); // Wait 10 milliseconds for next reading
}
here is the serial-LED-mouseclick-processing.ino (arduino sketch) file to download
And here's the code for the Processing programme.
import processing.serial.*;

Serial myPort;  // Create object from Serial class

void setup()
{
  size(200,200); //make our canvas 200 x 200 pixels big
  String portName = Serial.list()[1]; //change the 0 to a 1 or 2 etc. to match your port
  myPort = new Serial(this, portName, 9600);
}
void draw() {
  if (mousePressed == true)
  {                           //if we clicked in the window
   myPort.write('1');         //send a 1
   println("1");
  } else
  {                           //otherwise
  myPort.write('0');          //send a 0
  }
}
here is the serial-LED-mouseclick-processing_file.pde (processing) file to download
Here's a video of it working!
It's worth noting that the serial port could be 0,1or2. One good way to check this is to turn the serial monitor on in your Arduino IDE, and then go back into Processing and click run (it looks like a Play button). If the port is the correct one, it will throw an error saying:
Error opening serial port....Port busy
This page also gives a great little video to show how to get Processing to talk to the board, and vice versa..they call it 'shaking hands'!
Here's the arduino code
char val; // Data received from the serial port
int ledPin = 13; // Set the pin to digital I/O 13
boolean ledState = LOW; //to toggle our LED
void setup()
{
  pinMode(ledPin, OUTPUT); // Set pin as OUTPUT
  //initialize serial communications at a 9600 baud rate
  Serial.begin(9600);
  establishContact();  // send a byte to establish contact until receiver responds
}
void loop()
{
  if (Serial.available() > 0) { // If data is available to read,
    val = Serial.read(); // read it and store it in val

    if(val == '1') //if we get a 1
    {
       ledState = !ledState; //flip the ledState
       digitalWrite(ledPin, ledState);
    }
    delay(100);
  }
    else {
    Serial.println("Hello, world!"); //send back a hello world
    delay(50);
    }
}
void establishContact() {
  while (Serial.available() <= 0) {
  Serial.println("A");   // send a capital A
  delay(300);
  }
}
and here's the Processing code:
import processing.serial.*; //import the Serial library
 Serial myPort;  //the Serial port object
 String val;
// since we're doing serial handshaking,
// we need to check if we've heard from the microcontroller
boolean firstContact = false;
void setup() {
  size(200, 200); //make our canvas 200 x 200 pixels big
  //  initialize your serial port and set the baud rate to 9600
  myPort = new Serial(this, Serial.list()[4], 9600);
  myPort.bufferUntil('\n');
}
void draw() {
  //we can leave the draw method empty,
  //because all our programming happens in the serialEvent (see below)
}
void serialEvent( Serial myPort) {
//put the incoming data into a String -
//the '\n' is our end delimiter indicating the end of a complete packet
val = myPort.readStringUntil('\n');
//make sure our data isn't empty before continuing
if (val != null) {
  //trim whitespace and formatting characters (like carriage return)
  val = trim(val);
  println(val);

  //look for our 'A' string to start the handshake
  //if it's there, clear the buffer, and send a request for data
  if (firstContact == false) {
    if (val.equals("A")) {
      myPort.clear();
      firstContact = true;
      myPort.write("A");
      println("contact");
    }
  }
  else { //if we've already established contact, keep getting and parsing data
    println(val);

    if (mousePressed == true)
    {                           //if we clicked in the window
      myPort.write('1');        //send a 1
      println("1");
    }

    // when you've parsed the data you have, ask for more:
    myPort.write("A");
    }
  }
}
I've now managed to get the processing software to read the analogue signal from my board using the serial port basing the work on a tutorial I found here. It displays the roughly calibrated temperature in processing, and also plots this as a graph. I'm still not sure how to put axes/titles onto these graphs, but that can come later. Here's a couple of basic videos on this.
Here is the code for the arduino IDE:
void setup() {
  // initialize the serial communication:
  Serial.begin(9600);
}

void loop() {
  // send the value of analog input 5:
  Serial.println(analogRead(A5));
  // wait a bit for the analog-to-digital converter to stabilize after the last
  // reading:
  delay(2);
}
and here is the code for the processing software:
import processing.serial.*;

  Serial myPort;        // The serial port
  int xPos = 1;         // horizontal position of the graph
  float inByte = 0;

  void setup () {
    // set the window size:
    size(400, 300);

    // List all the available serial ports
    // if using Processing 2.1 or later, use Serial.printArray()
    println(Serial.list()); // This throws up a non-fatal error..I'm not quite sure how to improve this yet though.

    // The port on my mac is 1, but this could be 0 or 2.
    myPort = new Serial(this, Serial.list()[1], 9600);

    // don't generate a serialEvent() unless you get a newline character:
    myPort.bufferUntil('\n');

    // set initial background:
    background(0);
  }

  void draw () {
    // draw the line:
    stroke(127, 34, 255);
    line(xPos, height, xPos, height - inByte);

    // at the edge of the screen, go back to the beginning:
    if (xPos >= width) {
      xPos = 0;
      background(0);
    } else {
      // increment the horizontal position:
      xPos++;
    }
  }

  void serialEvent (Serial myPort) {
    // get the ASCII string:
    String inString = myPort.readStringUntil('\n');

    if (inString != null) {
      // trim off any whitespace:
      inString = trim(inString);
      // convert to an int and map to the screen height:
      inByte = float(inString);
      inByte=(-0.225*inByte)+217.65;
      inByte = map(inByte, 0, 150, 0, height);   //this maps the data to a max height of 150 pixels
      println(inByte);
    }
  }
here is the serial_read_temperature_plot_processing_file.pde (processing code) file to download
The next step was to write a processing programme to read in a .csv file which define the key time steps in the curing programme. It also converts this into a series of temperature steps/values defined for each second as would be required in the full curing oven programme. It them sends the programme to the arduino, in this case defining the brightness of the LED based on these surrogate temperature values. Firstly, here is the .csv data that I was using as my first test data:
time	heater
0	0
2	100
3	100
5	500
7	1000
8	500
9	500
10	0
here is a short video of this working:
and here is the arduino IDE code:
char val; // Data received from the serial port
 int ledPin = 13; // Set the pin to digital I/O 13

 void setup() {
   pinMode(ledPin, OUTPUT); // Set pin as OUTPUT
   Serial.begin(9600); // Start serial communication at 9600 bps
 }

 void loop() {
   if (Serial.available())
   { // If data is available to read,
     val = Serial.read(); // read it and store it in val
   }
      Serial.println(val);
     analogWrite(ledPin, val);
   delay(10); // Wait 10 milliseconds for next reading
}
here is the serial-csv-input-LED-output-arduino-sketch.ino (arduino sketch) file to download
and here is the code for the processing software.
import processing.serial.*;

Serial myPort;  // Create object from Serial class

void setup()
{
  String portName = Serial.list()[1]; //change the 0 to a 1 or 2 etc. to match your port...mine is 1
  myPort = new Serial(this, portName, 9600);

  // Sets the screen to be 640 pixels wide and 360 pixels high
  size(400, 300);

// Set the background to black and turn off the fill color
background(0);
//noFill();

}

void draw() {
  int temp_int;

  if ( myPort.available() > 0)
  {  // If data is available,
  temp_int = myPort.read();
  println(temp_int);
  //temp_int = myPort.readStringUntil('\n');
  }

  Table table = loadTable("data.csv", "header");
  for (int i = 0; i<(table.getRowCount()-1); i++) {
  // Access each row of the table one at a time, in a loop.
  TableRow row_i = table.getRow(i);
  float time_i = row_i.getFloat("time");
  float heater_i = row_i.getFloat("heater");
    float heat;
    int heat_int;


  int i_plus1 = i + 1;
  TableRow row_plus1 = table.getRow(i_plus1);
  float time_iplus1 = row_plus1.getFloat("time");
  float heater_iplus1 = row_plus1.getFloat("heater");

  if (i==0){
    heat=heater_i;
    heat_int= int(heat);
    myPort.write(heat_int);
    println(heat_int);
    delay(1000);
  }
    int counter=0;
  while ((millis()/1000)<=time_iplus1){
      if (heater_iplus1 == heater_i) {

        heat=heater_i;
        heat_int= int(heat);
        myPort.write(heat_int);
        println(heat_int);
        stroke(0, 0, 255);
        //line(0, height*.5, width, height*.5);
        delay(1000);
      }
      else {
        float step=(heater_iplus1-heater_i)/(time_iplus1-time_i);

        counter=counter+1;
        //print("step=");
        //println(step);
        heat=heater_i + counter*step;
        heat_int= int(heat);
        myPort.write(heat_int);
        println(heat_int);
        //stroke(0, 0, 255);
        //line(0, height*.5, width, height*.5);
        redraw();
        point(250, 250);
        delay(1000);
      }
  }
}
exit();
}
here is the serial_read_temperature_plot_processing_file.pde (processing code) file to download
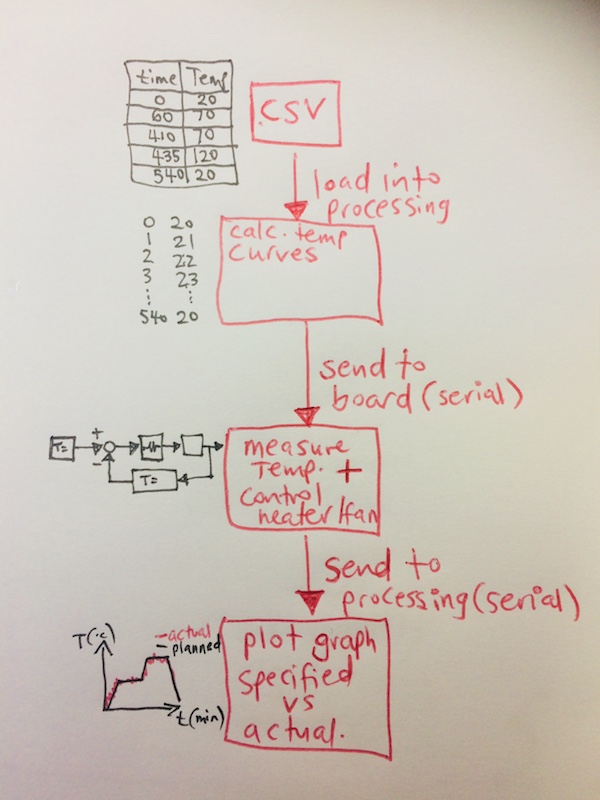
I produced this basic flow diagram to show my current thinking about how the process should flow.
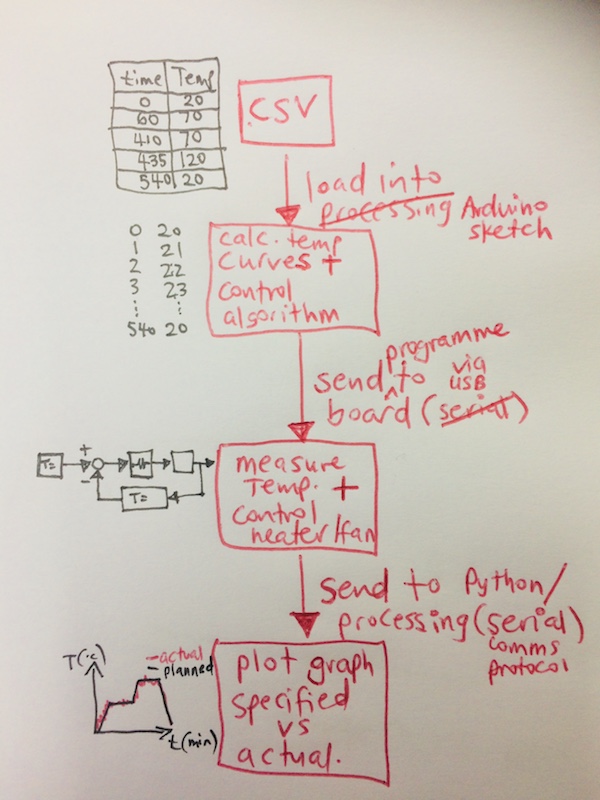
I was getting a bit confused about the workflow here. In particular, I wasn't sure whether I should be calculating the detailed temperature curves for each time step in Processing, or Arduino. Currently, it is done in Processing, but actually the conversion should be done in an Arduino sketch, it's more robust this way. In fact, I'm not exactly sure why I'm starting this process off in Processing anyway. This should all be done in my original Arduino sketch. Then I should only SEND data to Processing from the board so I can then plot specified vs actual temperatures on the same graph. In fact, I want to try this with Python, as it is likely to be a better format for me to plot my graph. Here's the updated workflow.
I managed to find a realtime plotter Processing programme here's the page which seems to work well, but having now been through the Arduino code and the Processing code, I can't seem to be able to identify HOW to specify which pin it is reading from. So so far, all I can do is get noise that is coming from my board. The link above has all the files and the steps too, but to summarise here are the steps required:
- Get ProcessingIDE to run the code. It is a neat and useful IDE for doing graphical stuff.
- Download controlP5 gui library and unzip it into your Processing libraries folder
- Connect the Arduino to the usb or serial port of your computer.
- Upload the example code (RealtimePlotterArduinoCode) to the Arduino
- Check serial monitor (at 115200) and check that it outputs data in the format "value1 value2 value3 value4 value5 value6".
- Close the serial monitor (since only one resource can use the serial port at the same time).
- Open the Processing sketch and edit the serial port name to correspond to the actual port ("COM3", "COM5", "/dev/tty.usbmodem1411" or whatever you have)
- Run the BasicRealtimePlotter.pde sketch. Note that it will also call on the GraphClass.pde and MockSerial.pde sketches.
This is what the programme COULD produce:
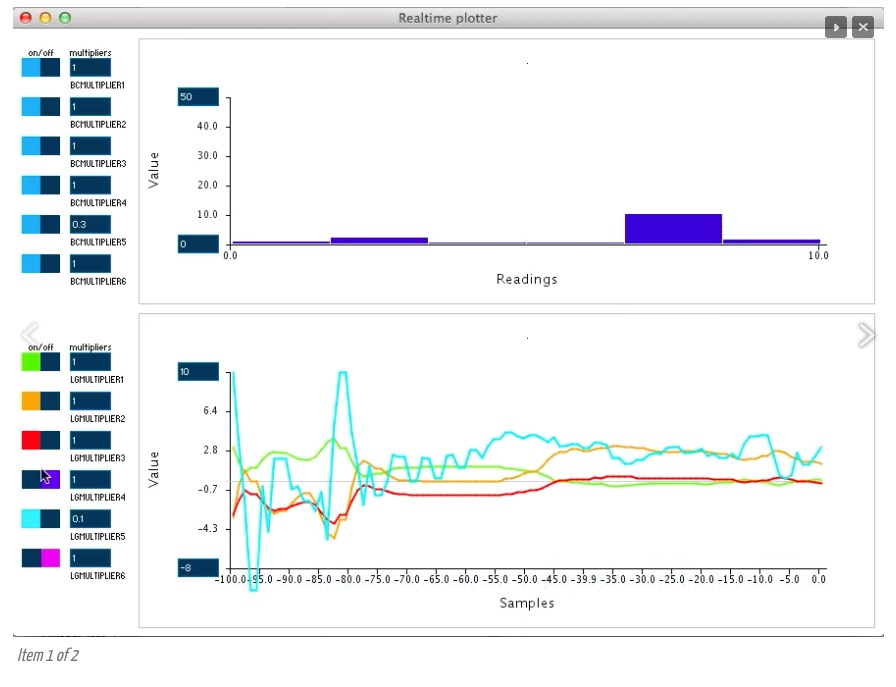
and here's what I am producing so far...
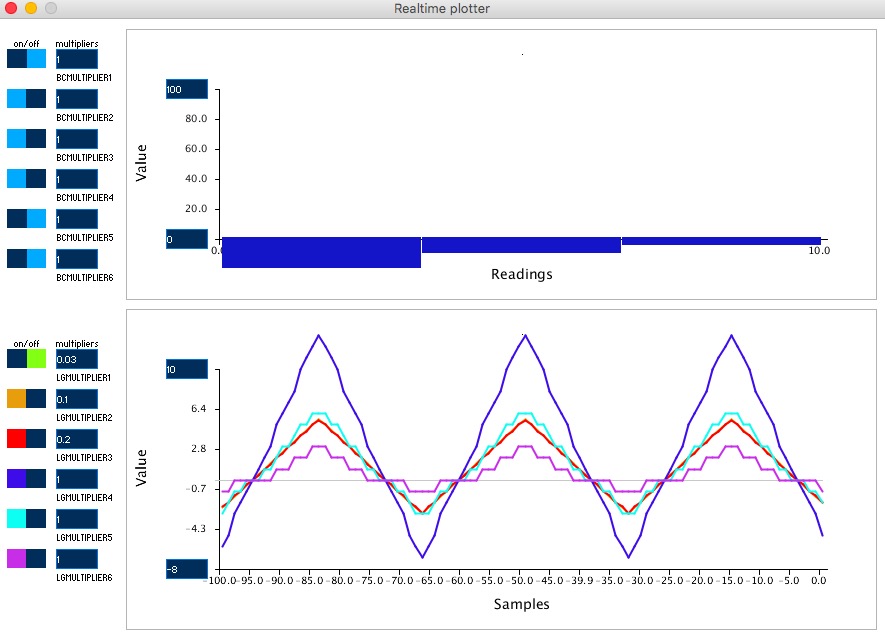
This is quite frustrating. If I can get this to work, it will be very helpful for me. I need two things:
- to read specific pins...I only need to read 1 pin!!
- to plot an entire set of data so that the data set grows from the time the programme is run (t=0) rather than having realtime data over writing every step, is there a way this can be done? eek!
I have put a query on the forum hosted by the author of this programme, so hopefully he'll come back with some kind response...fingers crossed!
HOORAHHH!!!! I found it!! in the arduino sketch, I needed to replace the 'value' in Serial.print(value); with 'Serial.print(analogRead(A5))'; or even better, create a new variable that calculates the ACTUAL temperature from the analogRead(A5), then Serial.prints that value. The only thing is that I don't fully understand what all the multipliers are doing on the left...I thought they were simply multiplying the signal by these values, but that doesn't seem to be the case...I need to play with this some more and see if there is any documentation on the author's github page.
I am now going to try to using the matplotlib with Python, documentation found here. Note that the command on this website is incorrect!!! there is no space between the -m and pip...so it comes out as -mpip...here's what worked for me (running them separately).
python3.6 -m pip install matplotlib
python3.6 -m pip install pyserial
sudo easy_install pyserial
This runs Python with the PIP module which installs the matplotlib and pyserial libraries. Hopefully that's now installed.
It took a bit of navigating to get to the user guide for the matplotlib, there was then loads of information about installation on the above link, in the end I found the user guide here.
I've now managed to get a really simple graph plotted in Python. Here's the code:
import matplotlib
import matplotlib.pyplot as plt
import numpy as np

# Data for plotting
t = np.arange(0.0, 2.0, 0.01)
s = 1 + np.sin(2 * np.pi * t)

# Note that using plt.subplots below is equivalent to using
# fig = plt.figure() and then ax = fig.add_subplot(111)
fig, ax = plt.subplots()
ax.plot(t, s)

ax.set(xlabel='time (s)', ylabel='voltage (mV)',
       title='About as simple as it gets, folks')
ax.grid()

fig.savefig("test.png")
plt.show()
here is the simple_plot.py file to download
and to run this plot, in the command window (in the python directory), run the following command
python simple_plot.py
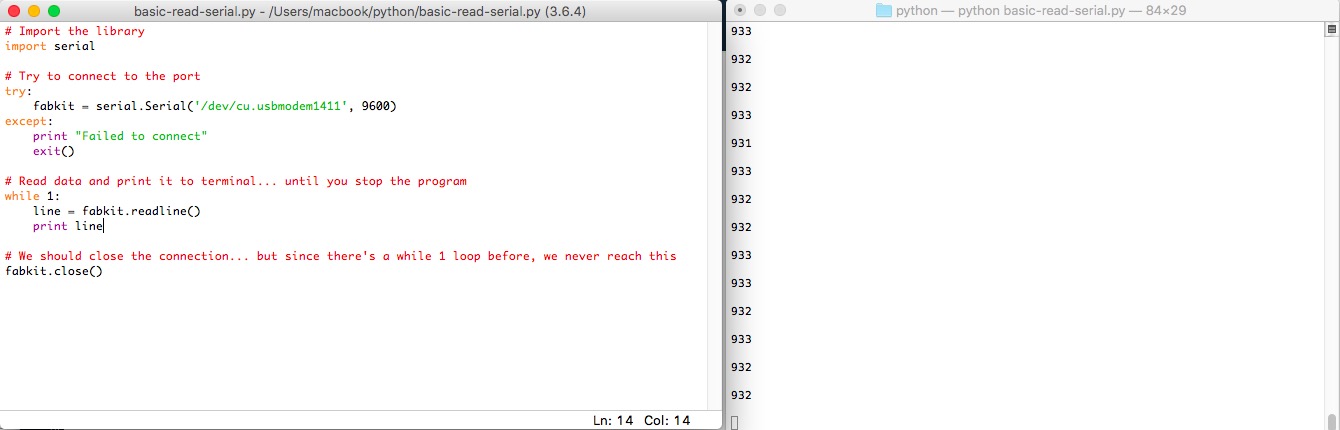
I then ran a basic programme (basic-read-serial.py) that I found on the fabacademy tutorials to see if I can get Python to read the raw analog data from my fab leo board (my port details included here). Here's the code.
# Import the library
import serial

# Try to connect to the port
try:
    fabkit = serial.Serial('/dev/cu.usbmodem1411', 9600)
except:
    print "Failed to connect"
    exit()

# Read data and print it to terminal... until you stop the program
while 1:
    line = fabkit.readline()
    print line

# We should close the connection... but since there's a while 1 loop before, we never reach this
fabkit.close()
here is the basic-read-serial.py file to download
I was getting the following error:
ImportError: No module named serial
I had to search for a command for the mac to try to solve this, and running the following code in the command terminal worked!!!
sudo easy_install pyserial
so I can plot a basic mathematical function as a graph in Python, and I can read the serial connection in Python, now to try to put those together. I found this site was a really a great summary. Here's the code they recommend:
import serial
import time
import csv
import matplotlib
matplotlib.use("tkAgg")
import matplotlib.pyplot as plt
import numpy as np

ser = serial.Serial('/dev/cu.usbmodem1411')
ser.flushInput()

plot_window = 20
y_var = np.array(np.zeros([plot_window]))

plt.ion()
fig, ax = plt.subplots()
line, = ax.plot(y_var)

while True:
    try:
        ser_bytes = ser.readline()
        print("test1")
        try:
            decoded_bytes = float(ser_bytes[0:len(ser_bytes)-2].decode("utf-8"))
            print("test2")
            print(decoded_bytes)
            print("test3")
        except:
            continue
            print("test4")
        with open("test_data.csv","a") as f:
            writer = csv.writer(f,delimiter=",")
            print("test5")
            writer.writerow([time.time(),decoded_bytes])
            print("test6")
        y_var = np.append(y_var,decoded_bytes)
        print("test7")
        y_var = y_var[1:plot_window]
        print("test8")
        line.set_ydata(y_var)
        print("test9")
        ax.relim()
        print("test10")
        ax.autoscale_view()
        print("test11")
        fig.canvas.draw()
        print("test12")
        fig.canvas.flush_events()
        print("test13")
        ax.set(xlabel='time (s)', ylabel='voltage (mV)', title='Analog temperature data (pin A5)')
    except:
        print("Keyboard Interrupt")
        break
here is the matplot-lib-live-plot-1.py" file to download
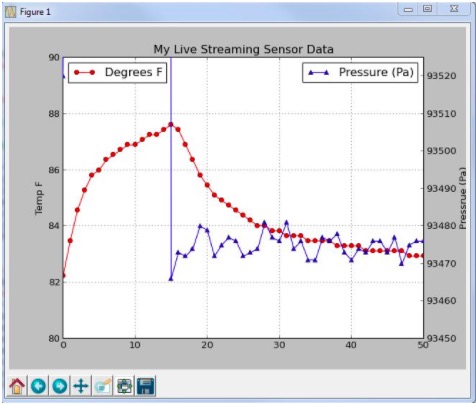
This is what the graph SHOULD look like.
It's so close!! with some debugging (putting in print lines after every line), I discovered that the problem is the line with the following line:
ax.relim()
initially I couldn't seem to get this to work. I think the problem is that the x-co-ordinates are linked to a very long number telling the time. I'm guessing it is struggling to set the automatic range on the x-axis. On the tutorial, this is between 0 and the max time value (about 18), so I'm guess there's something needed in the code to change the values on the x-axis. I thought it would be good to try to compare this code with a few others that claim to do the same thing. So below I've included some of these with the links and the code too, and I will use these to learn about the code that they're using...and hopefully I'll get it to work in the process!
So here's the next resource, which produced this code:
import numpy as np
import matplotlib.pyplot as plt
import matplotlib.animation as animation
import serial

fig, ax = plt.subplots()
line, = ax.plot(np.random.rand(10))
ax.set_ylim(-5000, 5000)
xdata, ydata = [0]*100, [0]*100
raw = serial.Serial("/dev/cu.usbmodem1411",9600)
raw.open()

def update(data):
    line.set_ydata(data)
    return line,

def run(data):
    t,y = data
    del xdata[0]
    del ydata[0]
    xdata.append(t)
    ydata.append(y)
    line.set_data(xdata, ydata)
    return line,

def data_gen():
    t = 0
    while True:
        t+=0.1
        try:
            dat = int(raw.readline())
        except:
            dat = 0
        yield t, dat

ani = animation.FuncAnimation(fig, run, data_gen, interval=0, blit=True)
plt.show()
here is the matplot-lib-live-plot-2.py" file to download
also found this tutorial, with good video! I haven't watched the video yet, but I think it gives a good, detailed run down of what is happening with the code. I must watch this video, and with any luck, by the end of it I will know how to debug the code and get my graph to generate properly.
and here is what the graph from this code SHOULD produce.
I did watch the video, and a few from this fella's back catelogue, but couldn't get the programme to work. It seems that these were all designed for an earlier version of Python, most likely 2.7, so I thought it might be best to install this. I never realised how much the different versions of Python can vary, but they do, and this has been a real pain so far. There were some really good instructions for this on a mac here. Effectively, in your terminal window run a series of commands. The first one here installs XCode which has a set of command line tools.
xcode-select --install
Then we install Homebrew, which is a package manager, here's the code to install it:
/usr/bin/ruby -e "$(curl -fsSL https://raw.githubusercontent.com/Homebrew/install/master/install)"
Then to install Python 2.7:
brew install python@2
Homebrew installs Setuptools and pip for you. Setuptools enables you to download and install any compliant Python software over a network (usually the Internet) with a single command (easy_install). It also enables you to add this network installation capability to your own Python software with very little work. Pip is a tool for easily installing and managing Python packages.
pip2 -V # pip pointing to the Homebrew installed Python 2 interpreter
You also need to install all the necessary libraries, including these (separately):
sudo pip install matplotlib
        sudo pip install numpy
        sudo pip install pyserial
        sudo pip install drawnow
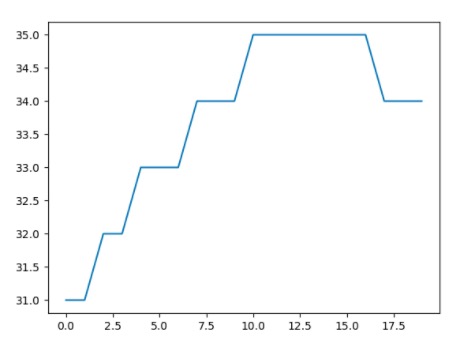
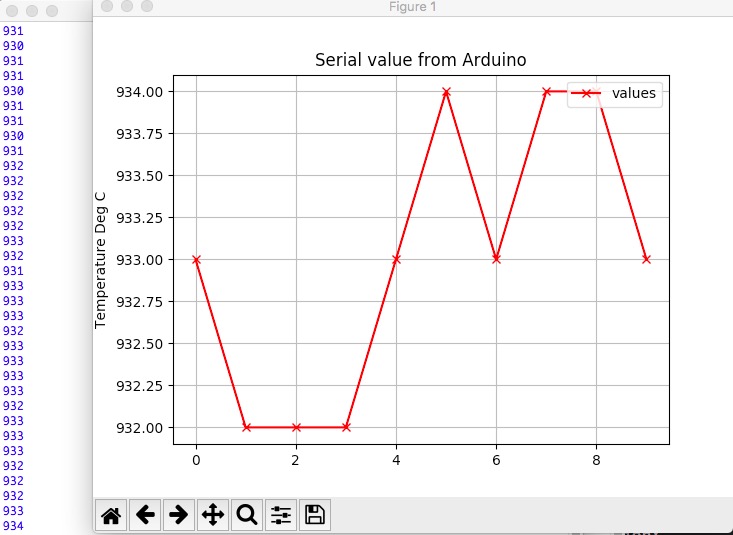
I found another youtube video which seemed like a nice simple programme to do what I wanted in Python2.7, so I thought I'd give this a try, since the last few attempts have not gone well...and it works!!! Here's a screengrab of the raw analog data (noting that the data is actually mV, not temperature as suggested in the y-axis title...that will come later once the thermistor has been calibrated):
after installing Python2.7, I needed to open the corresponding Idle2.7. To do this: in the command terminal type:
idle2.7
This opens the python shell. Then file > open the .py file. Then to run it, goto RUN menu > RUN MODULE. Alternatively, in the command terminal, goto the python directory and type:
cd python
python2.7 filename.py
e.g. python2.7 plot-serial-v4-WORKING.py
Here's the code for the arduino:
int value;
void setup() {
  // initialize the serial communication:
  Serial.begin(9600);
}

void loop() {
  // send the value of analog input 5:
  value=analogRead(A5);
  Serial.println(value);
  delay(500);
}
And here's the code for to run in Python 2.7.
import serial
import numpy
import matplotlib.pyplot as plt
from drawnow import *
values = []

plt.ion()
cnt=0

serialArduino = serial.Serial('/dev/cu.usbmodem1421', 9600)

def plotValues():
    plt.title('Serial value from Arduino')
    plt.grid(True)
    plt.ylabel('Temperature Deg C')
    plt.plot(values, 'rx-',label='values')
    plt.legend(loc='upper right')

for i in range (0,600):
    values.append(0)

while True:
    while (serialArduino.inWaiting()==0):
        pass
    valueRead = serialArduino.readline()

    try:
        valueInInt=int(valueRead)
        print (valueInInt)
        if valueInInt <= 1024:
            if valueInInt>=0:
                values.append(valueInInt)
                values.pop(0)
                drawnow(plotValues)
            else:
                print "Invalid! negative number"
        else:
            print "invalid too large"
    except ValueError:
        print "Invalid! cannot cast"
and here are the files to download:
here's a video of me loading idle2.7 and python2.7, opening the file, and running the graph:
some thoughts on this as I get ready for bed. Firstly, I'm very relieved that I've managed to get this to work. There were so many dead ends, errors, frustrations this week. I tried quite a few things, and didn't even get as far as I set out to. As I type this, it's actually near the end of the networking week and I've revisited this task since it frustrated me so. In my mind originally I didn't think graphing realtime data should be that challenging, and although I still don't think it should be, clearly the piecing together (or selecting) code to run is very slow and not hugely rewarding...although in the long run helpful and does teach me something. What I would like to do is to review the previous codes in more detail, to pull out things that would/could work, relating to presentation, to the updating of the axes, and of course to plot two curves, one for actual temperature, one for planned temperature...perhaps also plot humidity...just like my Tado app does! Then of course there's the interfacing of this, ideally I'd like to plot this kind of graph on an app, or at least a website. I think I will park that for the moment though, and leave it as an added bonus to do if I get time this time round...or I can always revisit it after. Next steps:
- get arduino to read .csv file and convert this to minute by minute data.
- include a control programme in my arduino sketch to control temperature using PID - if I get time! if not, just revert to the basic thermostatic control I've used in output devices week.
- in networking week, try to put on a wifi or bluetooth board to remotely turn on, control, and log temperature from the heating circuit.
note for future...and I just stumbled across this tutorial, which describes how to make a Standalone Arduino 6 channel Triggered Oscilloscope. I wouldn't mind trying this also...if I get time.
Ideas, maybe for next year:
- read thermal IR images from thermal imaging camera and read temerature as you run mouse over the image. Could use ImageJ or Matlab, here's a useful page. Could extend this work to connect camera to my board, then have live feeds through computer?