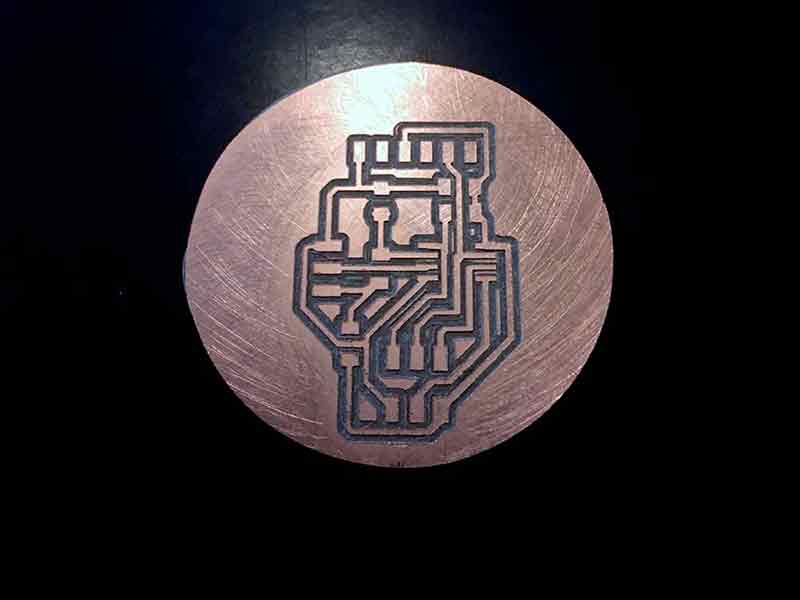
WEEK 11
INPUT DEVICES

ASSIGNMENT DETAILS
Measure something: add a sensor to a microcontroller board that you have designed and read it.

For my input device, I chose to use the photoresistor as a light sensor. I figured it might be an interesting sensor to use with a NeoPixel. The parts used for this project include:

---> ATTiny45
---> 1 visible light phototransistor (1080-1380-1-ND)
---> 2 x 10k resistors
---> 1 0ohm jumper
---> 1uf capacitor
---> 6 pin program header pins

This circuit design shows a space for 6 FTDI pins but only 3 are needed. Tx, VCC, GND.


THE BOARD


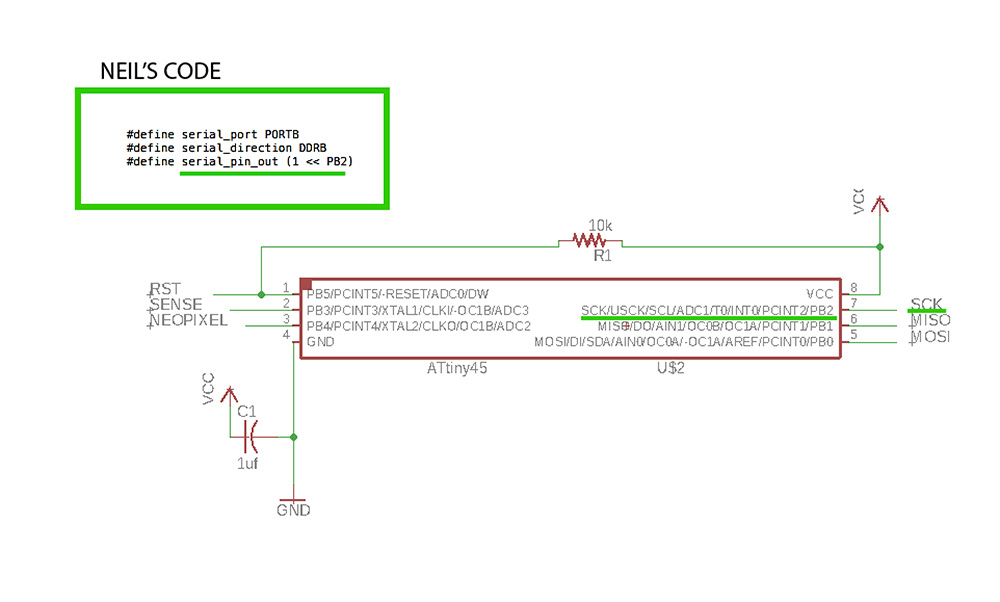
This board was one of the simpler options for the week. I took Neil's basic design and added a couple features. One was to make some traces that could later be used for NeoPixel output. The other was to make the board circular so that it could fit in the middle of a NeoPixel holder that I designed for the Molding & Casting week.

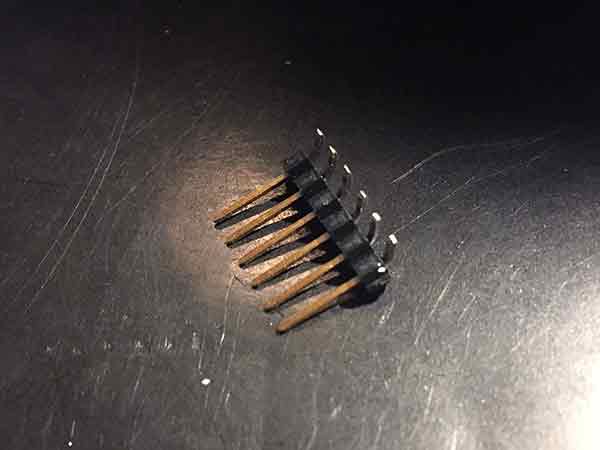
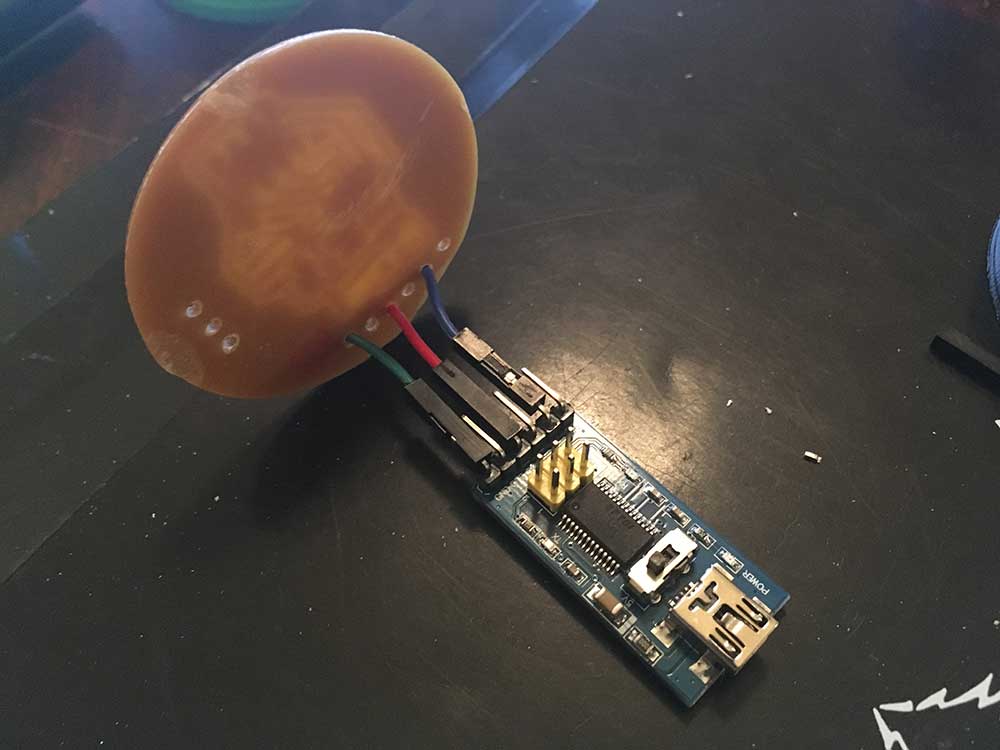
Because it was going to sit in the middle of this ring, I thought I would bend the FTDI pins so that they could stick out front.


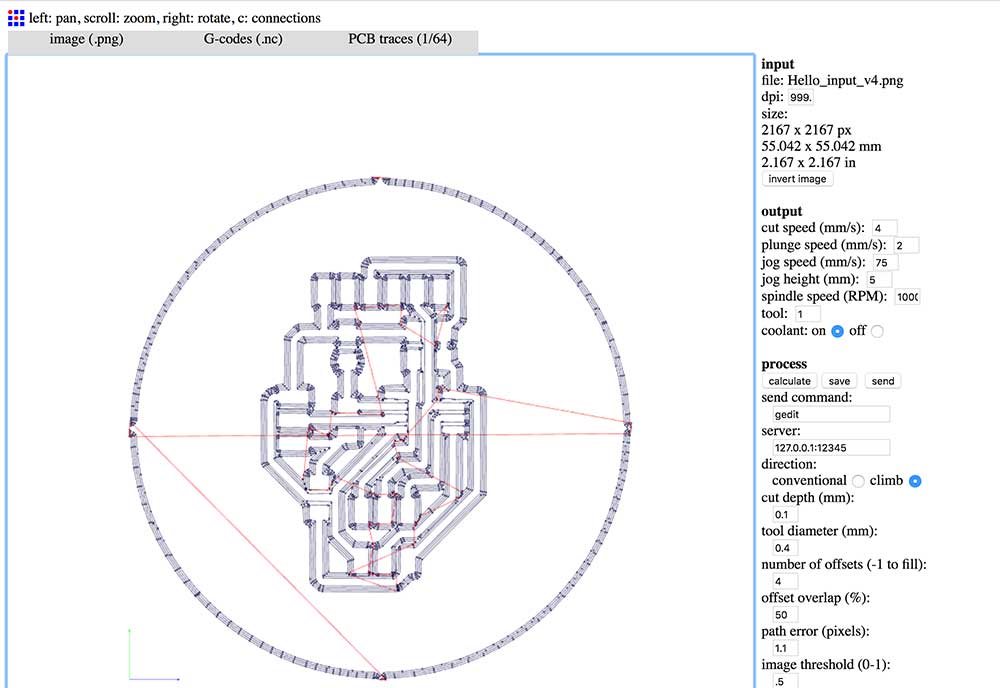
I took the traces and input them into mods. I used the default settings, PCB Traces 1/64 with 4 offsets.


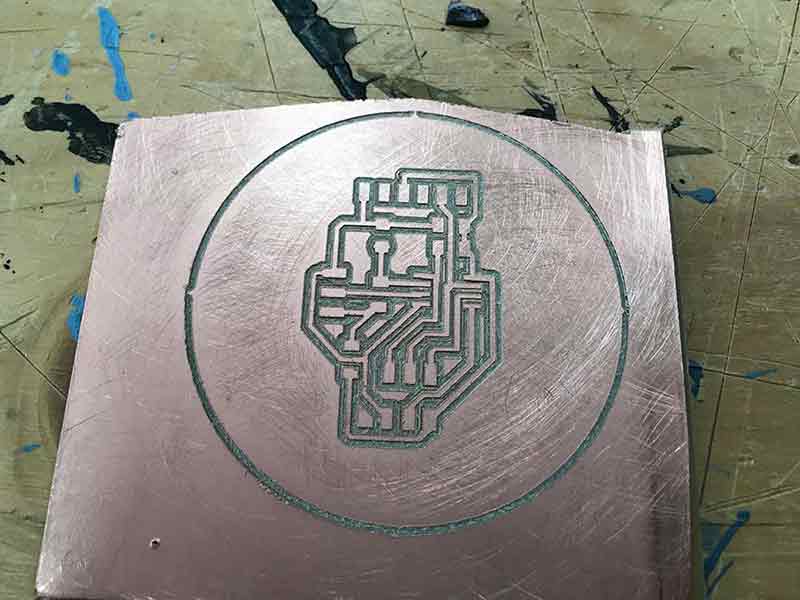
I used the mill at èchoFab with the same process I used in Week 5. Once the traces were milled, I had to switch the bit to cut out the perimeter of the circle. I moved the router away from the recently milled traces to have a look and accidentally pressed Reset Zero in Universal Gcode Sender. Oops! This reset the origin. I did not document this error but essentially, now it was going to be hard to cut the circle because I lost my place. Unlike a square shape with a defined corner, it was a lot of guess work. I was able to get it pretty close and I cleaned it up with sandpaper.


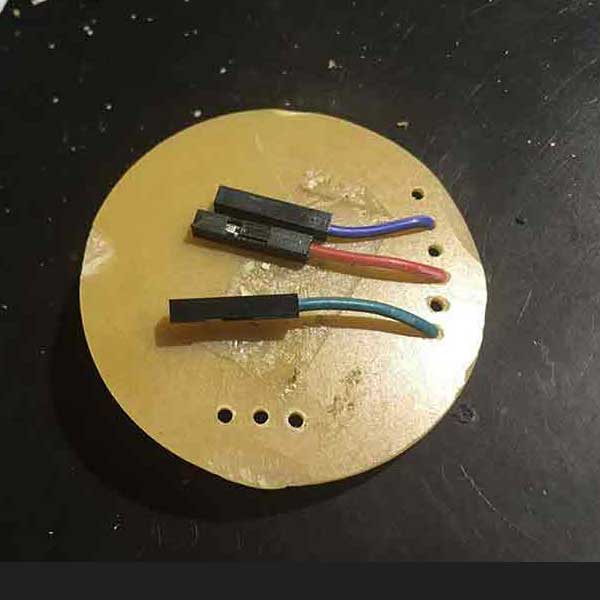
It didn't take a long time for the FTDI pins to rip off the board. It was a happy accident. It made me consider ways of getting the connectors out to the back of the board. I might end up doing this for my final project. If I don't have to, I would rather avoid adding Vias.


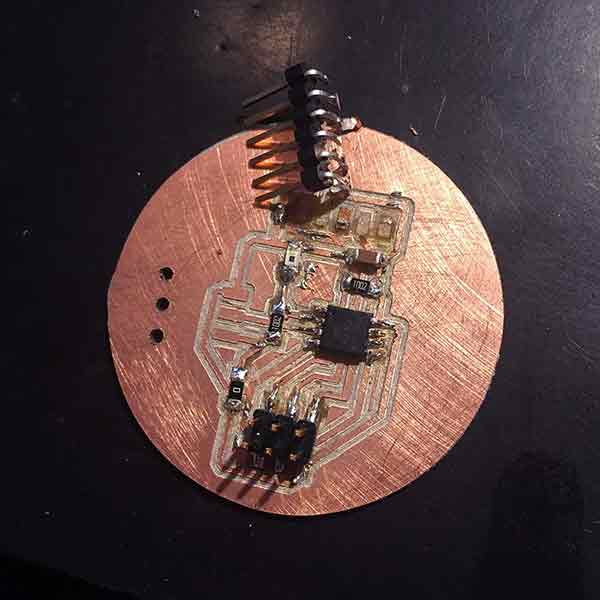
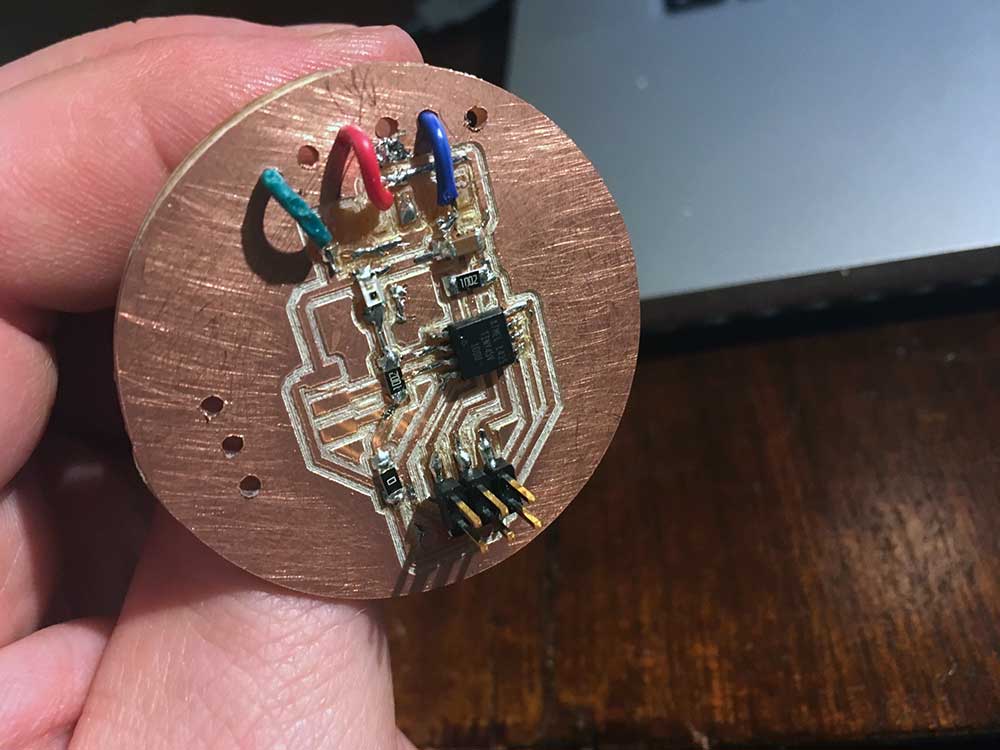
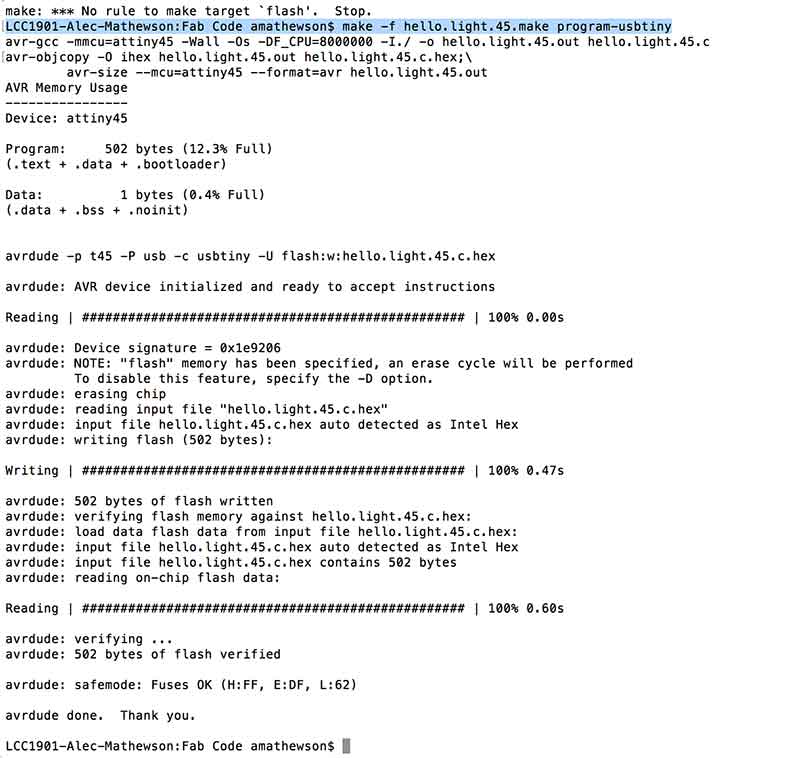
Once the board was ready it was time to load the program and test it out. I attached the usb to FTDI converter I had and my FabISP.


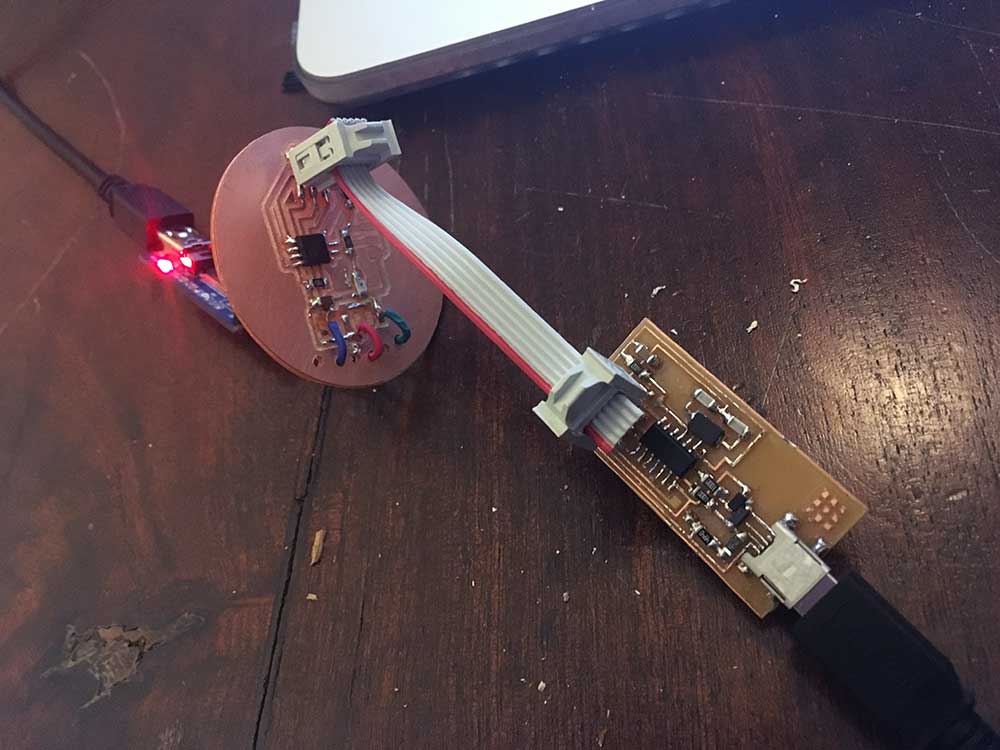
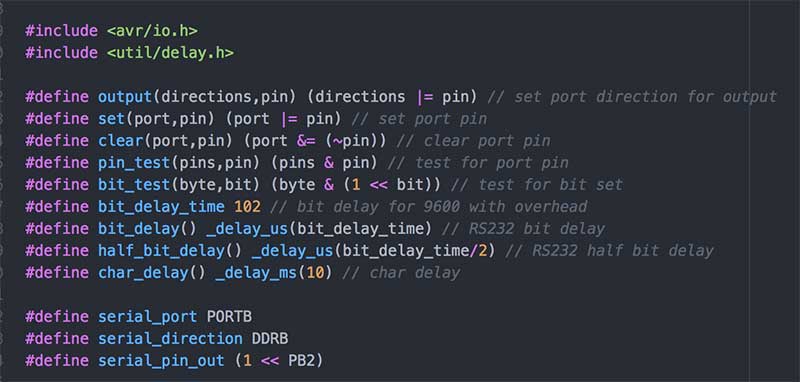
I copied Neil's Light sensor code from the Fab Academy input page into a folder on my computer. I navigated to the folder and used avrdude to generate the .hex file which I then pushed onto my board successfully.


THE DATA

With Neil's code loaded onto the board I opened up Max MSP and set it up to read the RX pin which was being fed the data being gathered by the light sensor on Pin3 with the ADC (analogue to digital converter). These are the necessary objects in Max MSP to make this work:

---> Serial - read data on the ATTiny85 connected with the FTDI to USB
---> Metro - set up a clock to sample the data
---> Router - route the incoming serial to only read data on pin 3
---> Number Box - read the data coming in as integers
---> Slider - to visualize the data


---> 1st attempt - POSSIBLE CONNECTION ISSUE

As can be seen in the following video. The data is jumping around a lot. This was due to the delicate connection between the wire and the broken trace I was connecting it to. You can see the values popping to max. This suggests spike in the signal.


---> 2nd attempt - SOLVED

I was able to solder the wire directly to the SCK pin on the 6 pin program header which was connected the PB2. When you look at Neil's code he tells you which pin is associated to the data output serial_pin_out (1 > >PB2). With that, I double checked which pin in the schematic was PB2 which I needed to make a new connection to.

Neil's hello.light.45.c code

Using hook-up wire, I connected the RX pin to the SCK pin. You can see this in the video below. This bypassed any broken traces or issues with the circuit that could have been causing the noise on the signal. Once the signal was cleaner, I used Max MSP to further smooth the signal using delay objects (see the diagram at the bottom of this page). I did not make any changes to Neils code in all of this assignment. It is still quite complicated for me so I used the tool I knew best. In the end, I was able to get a nice representation of the data. I could have spend a lot more time getting the sensitivity right and reducing any perceptable latencies but I think this was a reasonable representation.


This video shows the data flow. There are three number boxes. The one on the left is reading all the data from the Rx transmission but I am only are getting data on PB2 so I need to route that information into a separate box. I then take that data and smooth it, send it to a slider for further visualization. The look of this is inspired by the Python examples posted on Fab Academy's site.


For a little more detail...