Week11 : Input devices
For the wave observation with oscilloscope check:
Group page
Download data
Eagle
Image
Program
Step response measurement
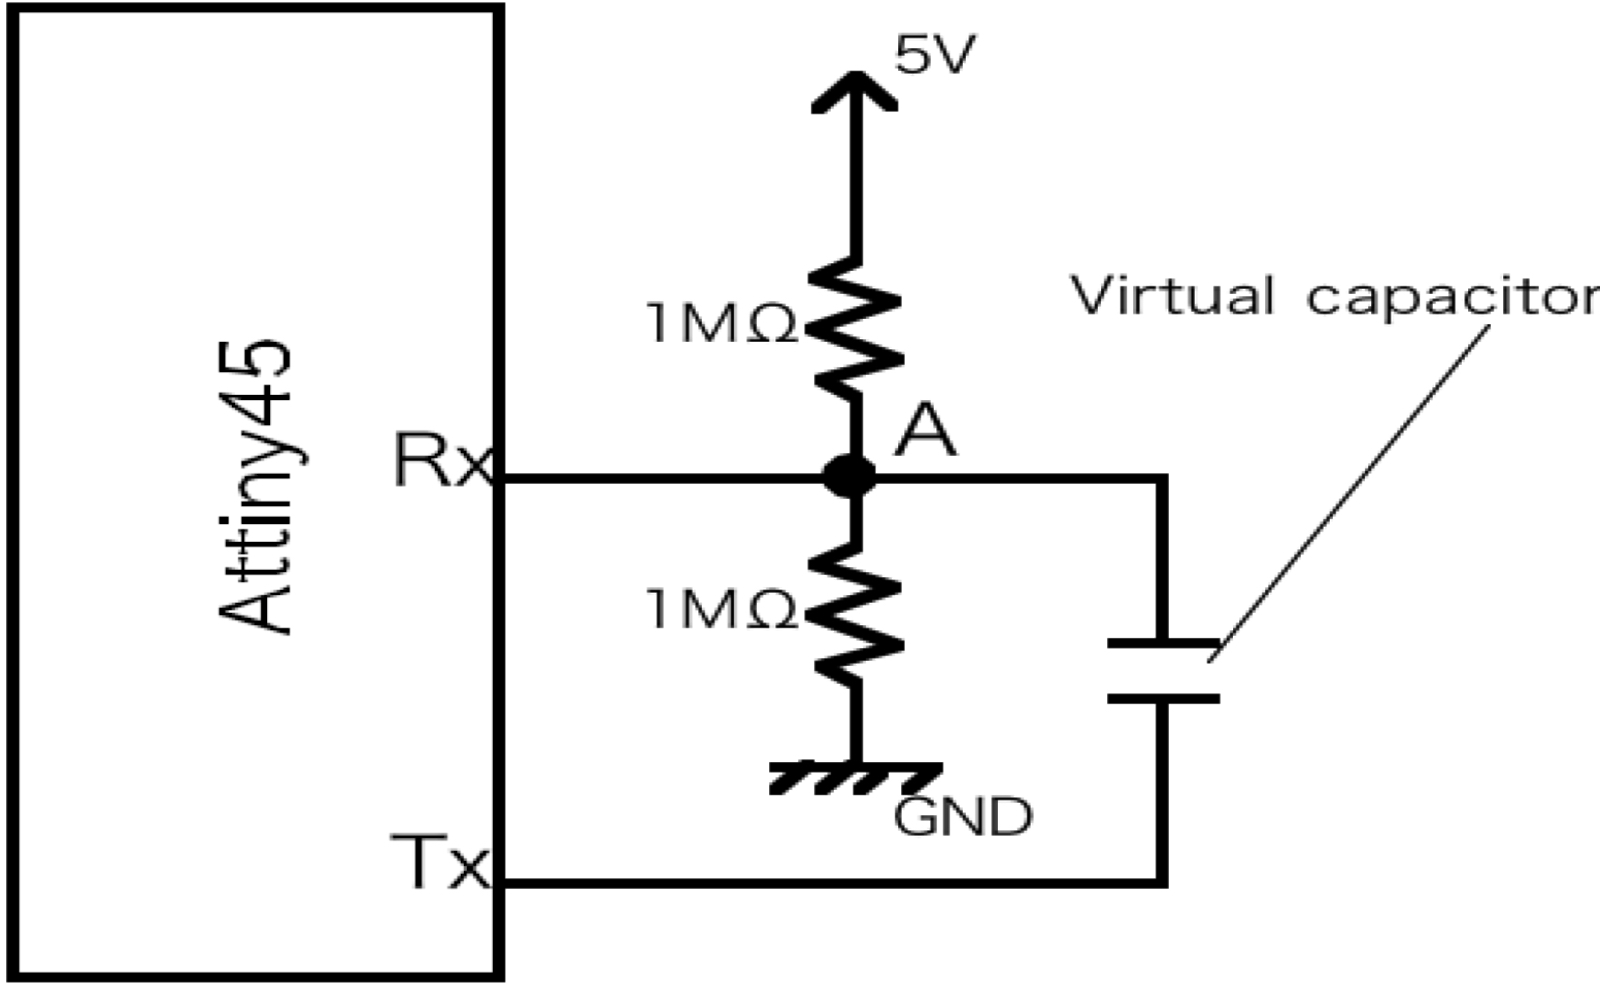
It is also called as a capacitive sensor, that can sense proximity by measuring respond time when Tx side set to HIGH. This time changes according to the (virtual) capacitor created between Tx side electrode and Rx side electrode. Capacitance varies depends on what between Tx and Rx electrodes.
I am planing to use this system in my final project to let each modular light units know when they are touched or held by a person.
Designing circuit
Basically I am just tracing Neil’s design (Hello.txrx.45) that could be found in Fabacademy Week11 page.
The process how to draw circuit design with Eagle is covered on week7 : Electronics design.
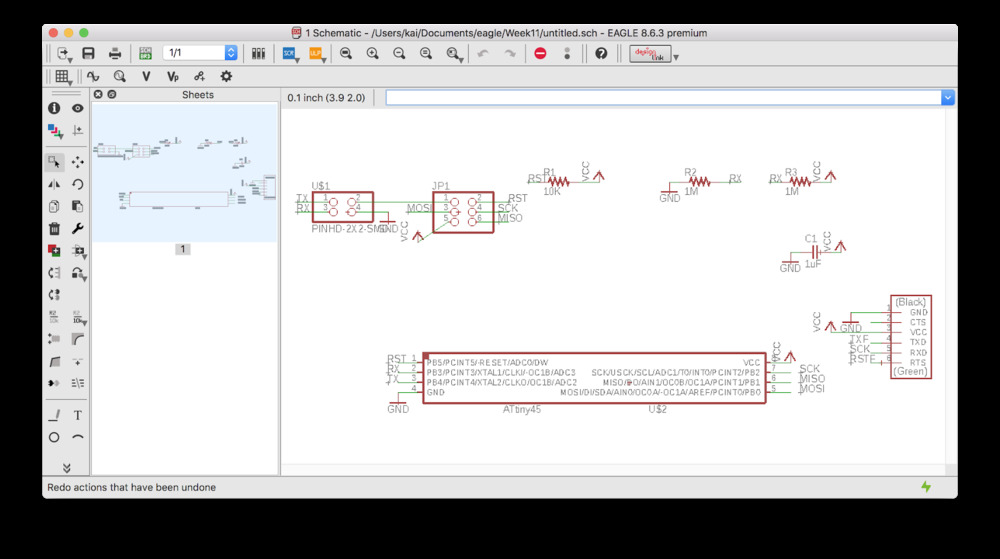
- Eagle schematic
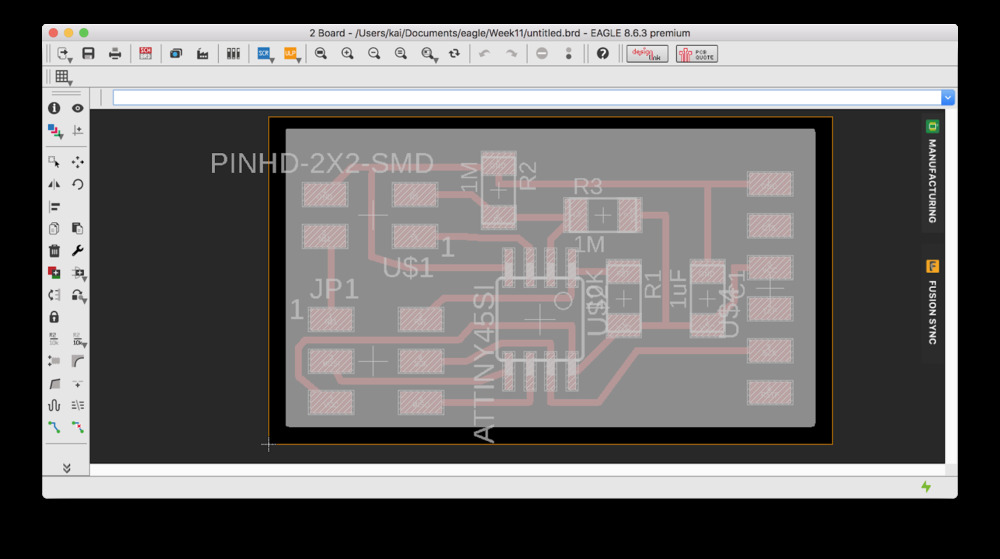
- Eagle board design
Brief summary of what to do’s to design circuit on Eagle:
- In schematics,
addcomponents. - Using
netcommand and pull the wire out from all components. nameclick wire you made in 2. Wires that have same name will be connected.labelto show name of the wire.- Insert
value - Run
erc(Electrical Rule Check) - Switch to board view
- Set grid size to 0.05 inch. (set Alt to small enough value for severe adjustments of trails)
Changewiring width to 0.016inch.- Put everything into order.
routeandripupto draw and erase traces. (Draw trace first, try adjust the trace by right click and switch the trace mode, then tweak the trace by clicking and dragging while holding Alt)- Draw board outline on Layer 48 while the
polygontool is selected. - Adjust the orange frame outline (actual size of the image which will exported).
- Run
drc(Design Rule Check) with Clearance setting: 0.4mm (as you use 1/64 = 0.396875mm endmill for inner traces). - Export the traces each (File > Export > Image) with “Monochrome” / “800dpi” setting.
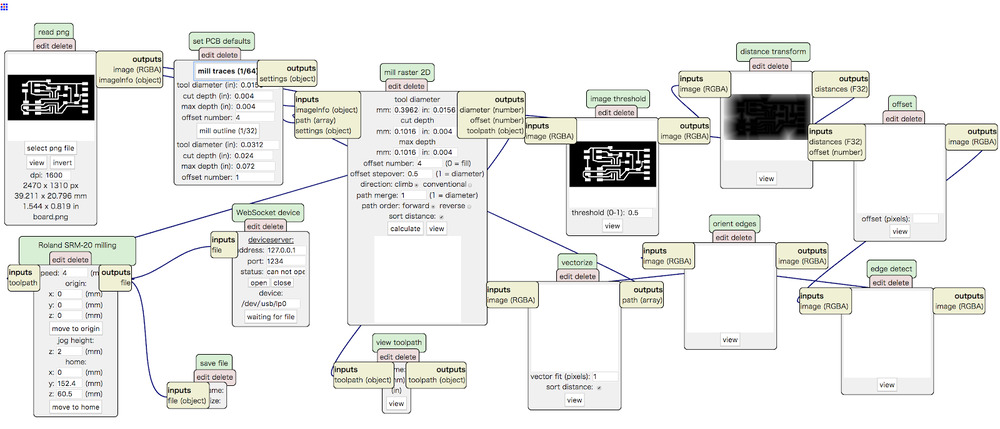
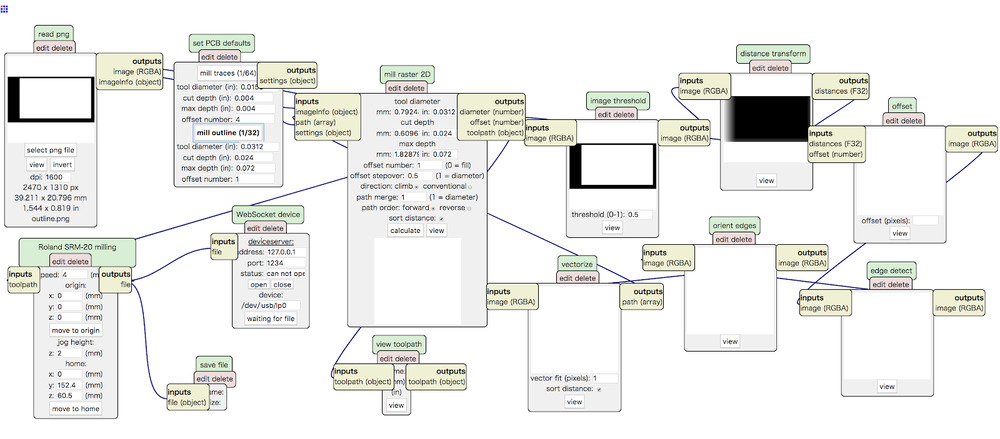
Generate tool path data out of image : Mods
Again, refer to week7 : Electronics design for complete tutorial.
Mill traces (1/64)
Dpi : 1600 (Eagle export setting is 800dpi but it comeouts in twice big scale. 1600dpi setting is to fix this problem)
Origin : xyz all 0 (setting bottom left corner of the image to the origin)
Issue
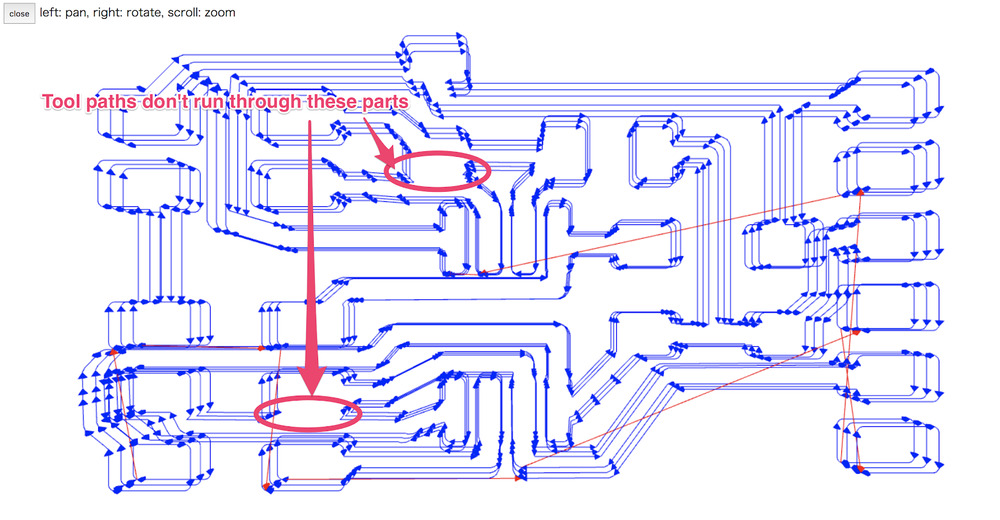
*There was no tool path where supposed to. Ended up slightly shave copper layer with ultrasonic cutter after the milling.
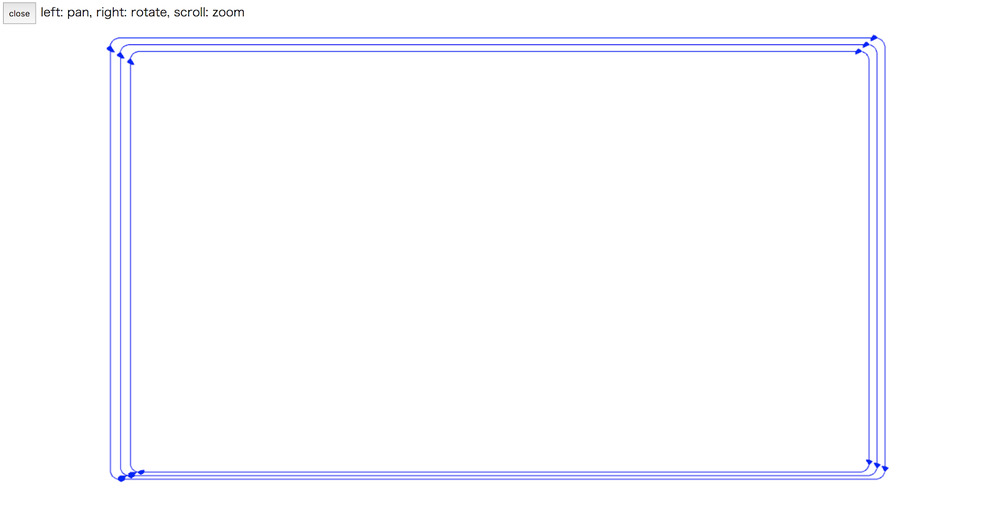
Mill outline (1/32)
Dpi : 1600 (Same reason as mill traces setting mentioned above)
Origin : xyz all 0
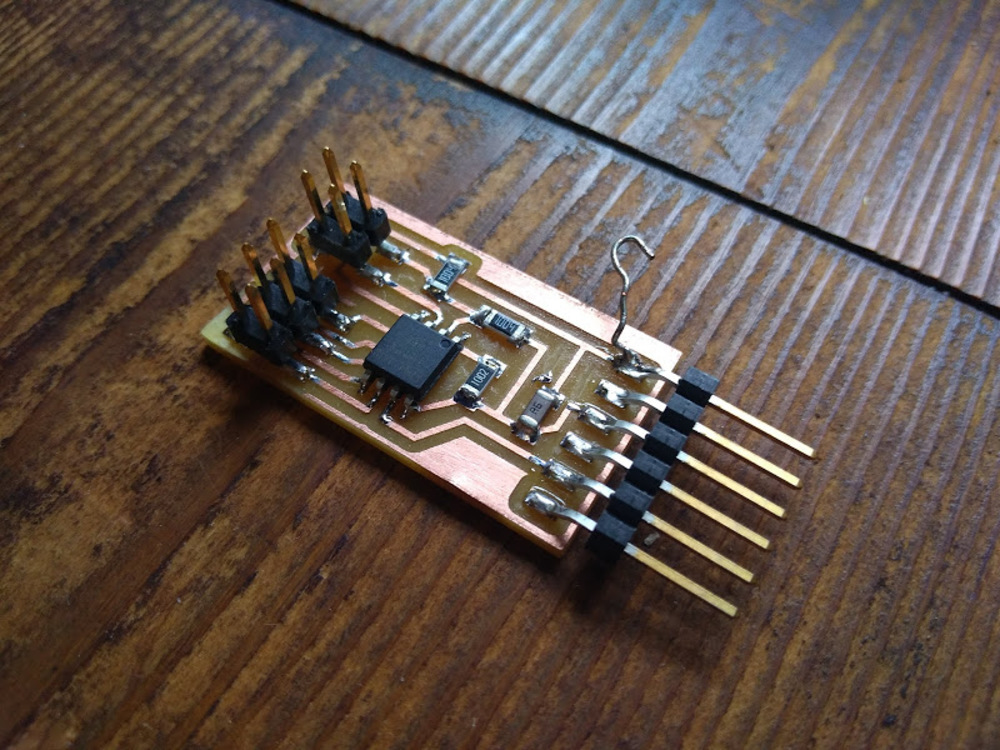
Milling & Assembling
Milled one-sided FR1 (phenolic paper) with SRM-20.
Complete tutorial week7 : Electronics design.
Program
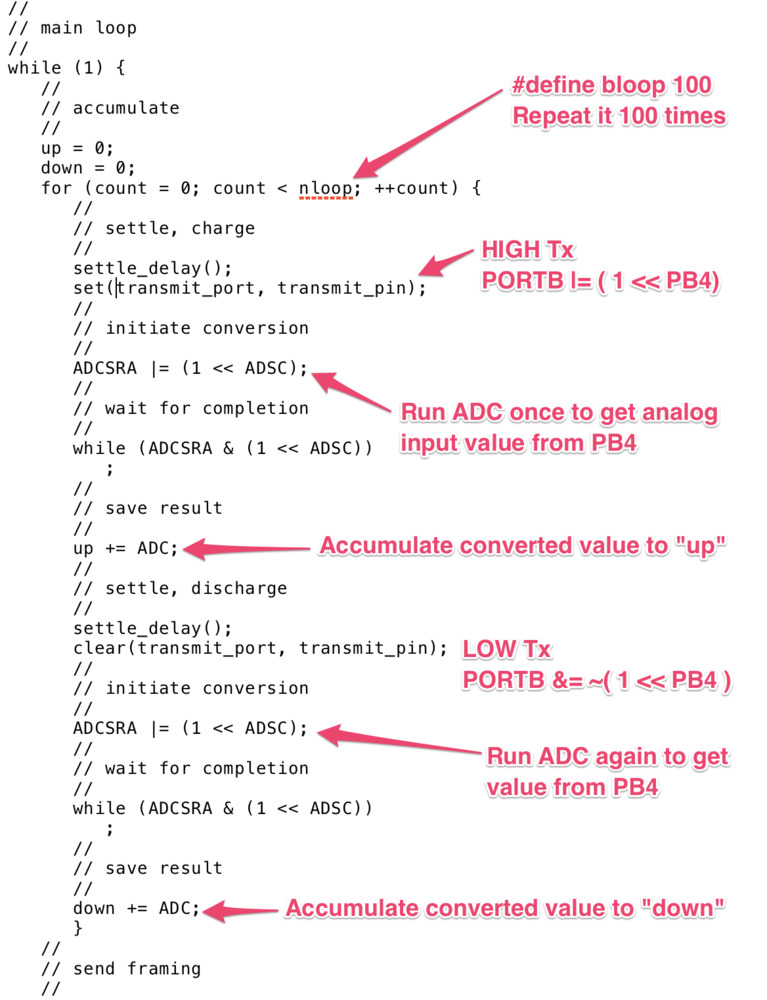
Program reads analog voltage right at the bump and at the drop, and accumulate them while 100 times iteration (Neil mentioned in the lecture that this is for removing noise).
In the end of each 100 times iteration, the program sends the accumulated data of bumps (which is stored in variable “up”) and the drops (stored in “down”) via serial transmit to PC.
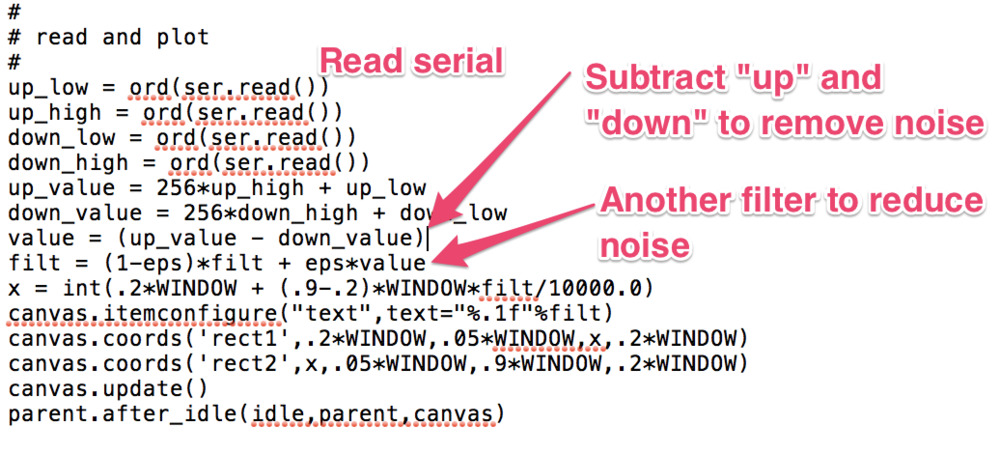
Python program is run on PC, and compare “up” and “down” to cut the noise.
C program
Python program
Result
Other applicationsObserving signal
Multi-function oscilloscope.
- Device
- Software
Waveform virtual instrumentation software
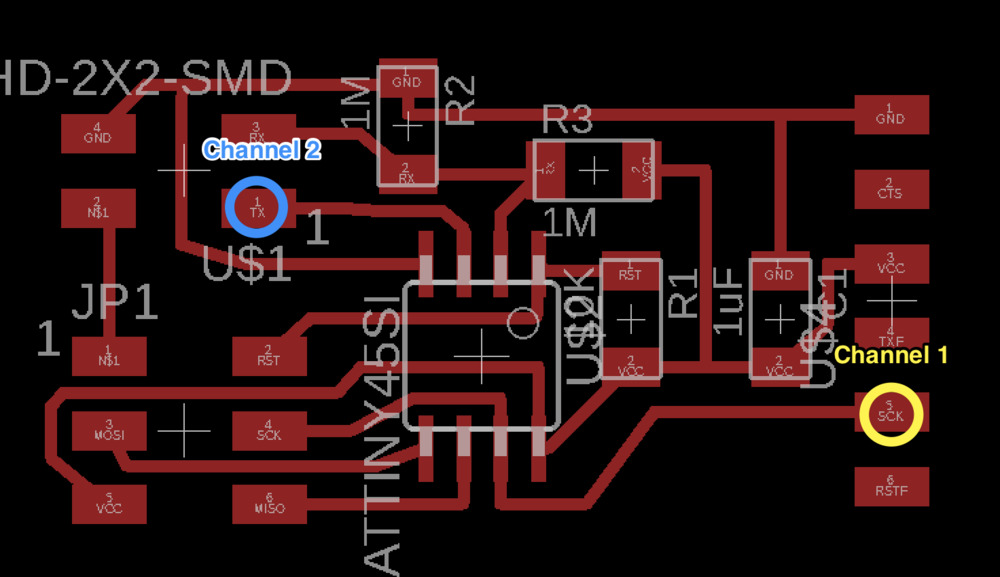
Setting oscilloscope
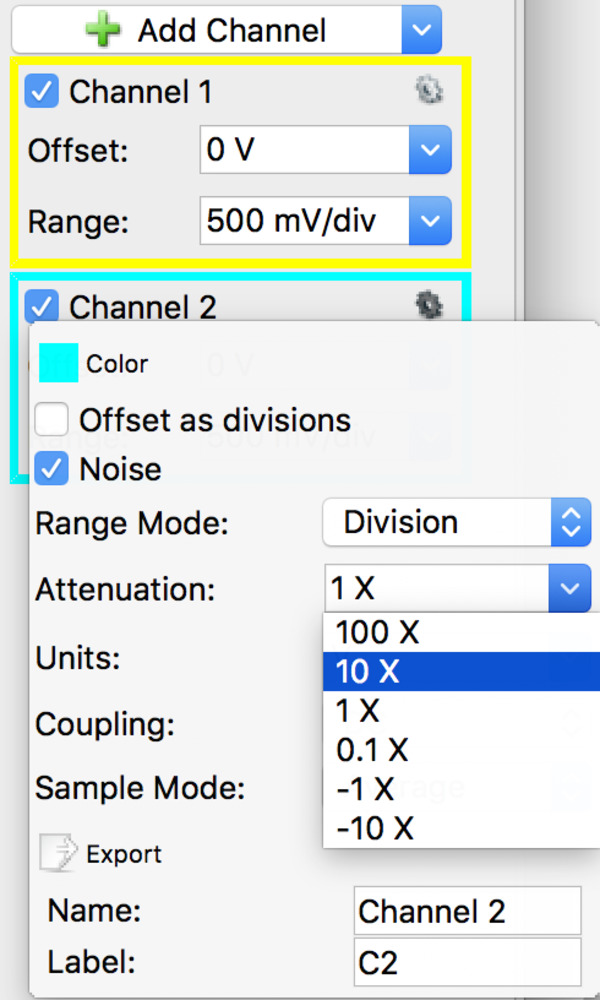
Change probe setting
(Necessarily if you use probe not 1:1)
- Hit setting mark on the upper right corner of the channel window.
- Attenuation : 10X (depends on the probe type you are using)
Main screen in Oscilloscope mode.
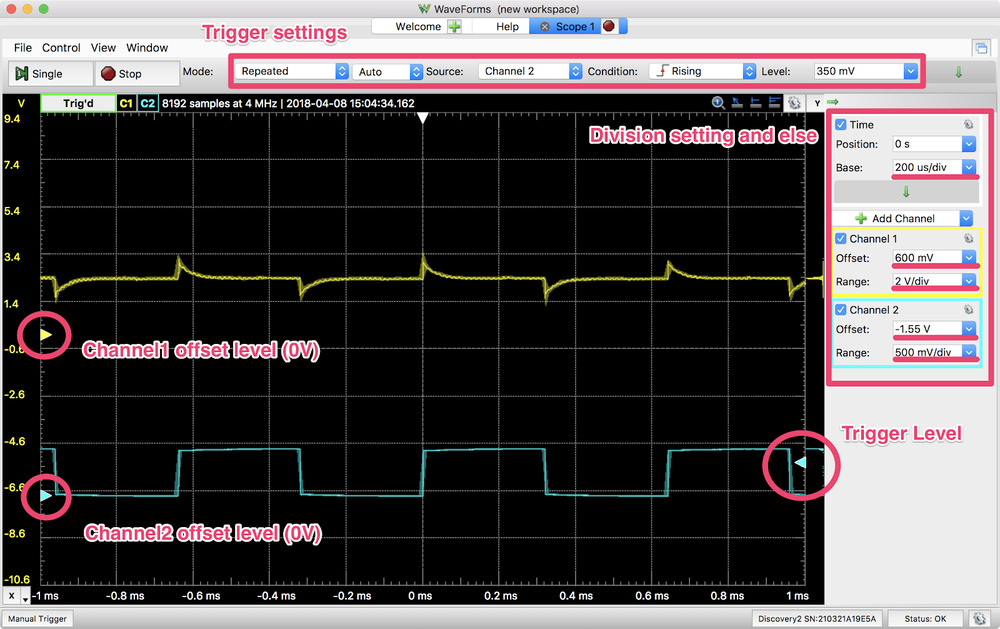
Tweak with the division setting
-
Baselets you decide the time length per one division on X axis. -
Offsetchanges the position of the each channel wave. (You may also click & drag triangular handle on the left corner of the black screen) -
Rangedecides voltage range per one division on Y axis.
Set a trigger
-
Select sourcewhich channel you wanna use as a triger. -
Select conditionRising will do in most cases. -
State
voltage levelthat will identified as a trigger (you may also grab triangular handle on the right corner of the black screen)
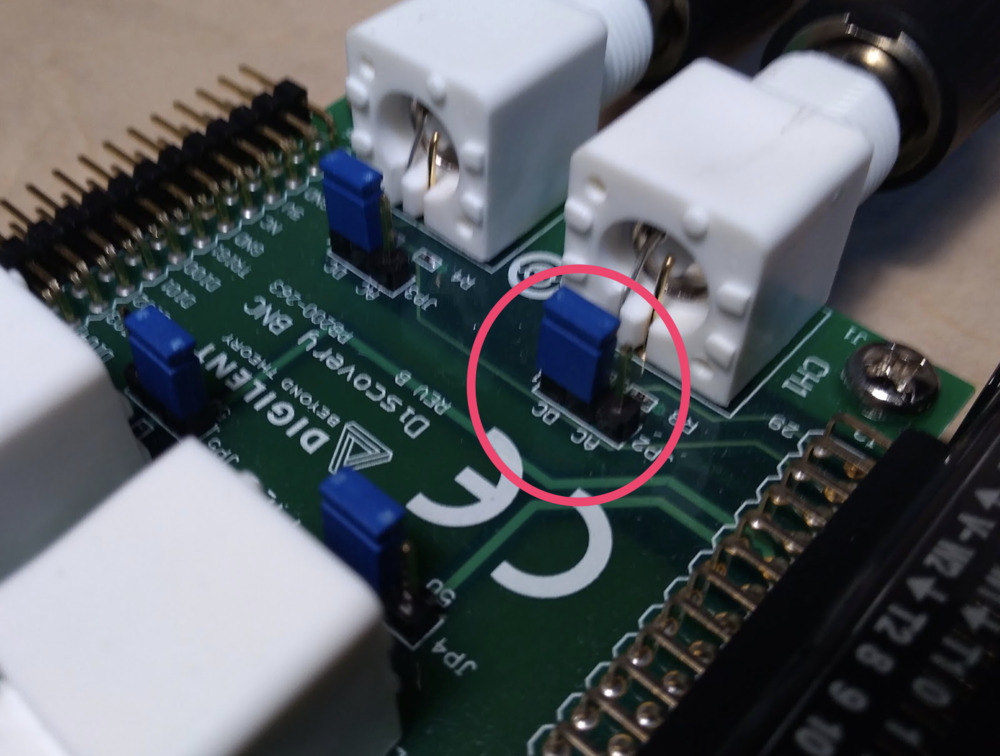
Set to DC mode
To look into absolute value of voltage level, Discovery board should be set to DC mode.
Make sure that the blue tab is on DC side.
Measuring
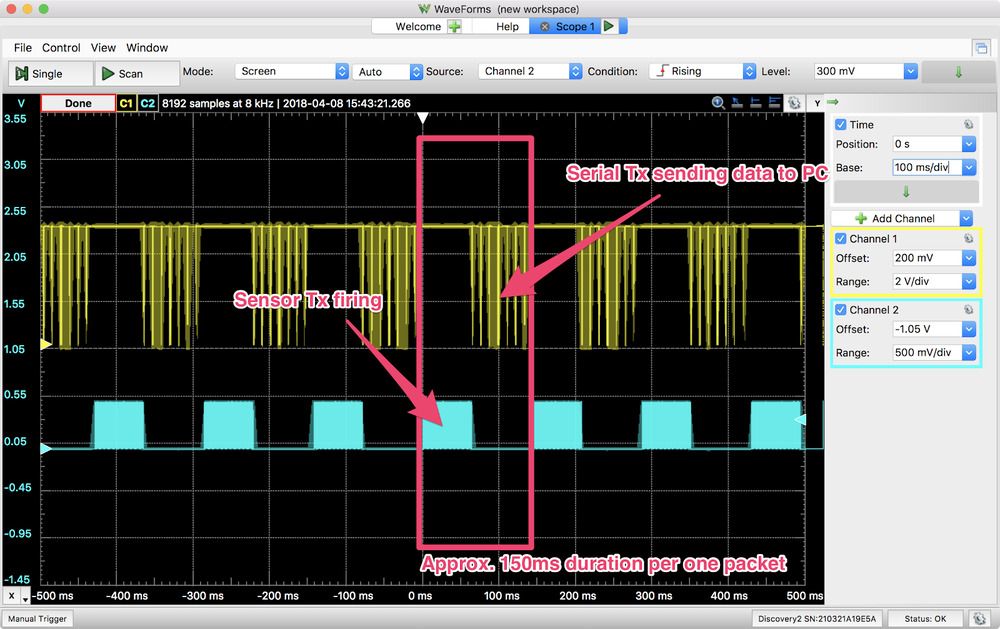
150ms cycle of measuring and sending out data could be seen at this point.
Sensor Tx fires, then Serial Tx sends some kind of data to PC.
Take a bit deeper look on sensor part…
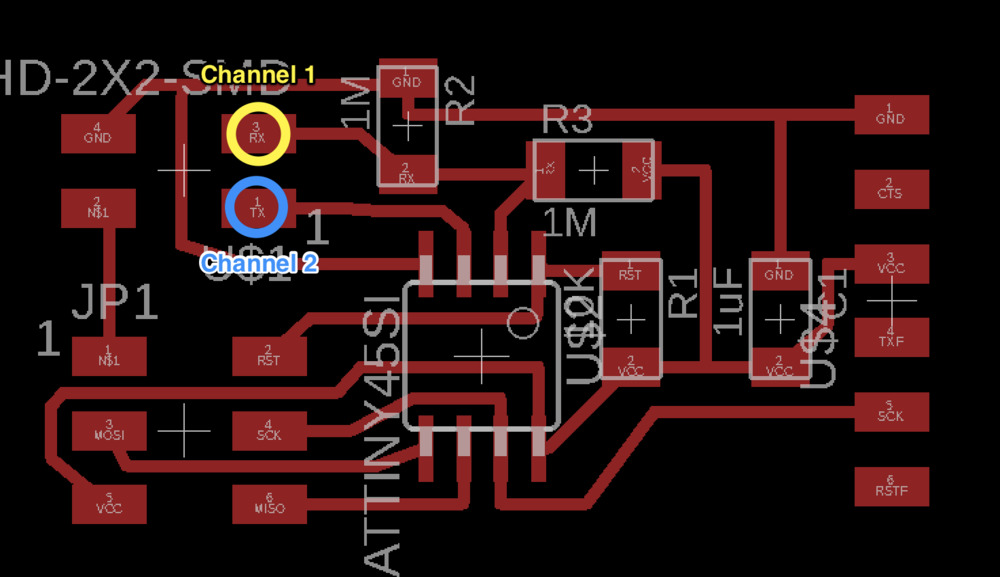
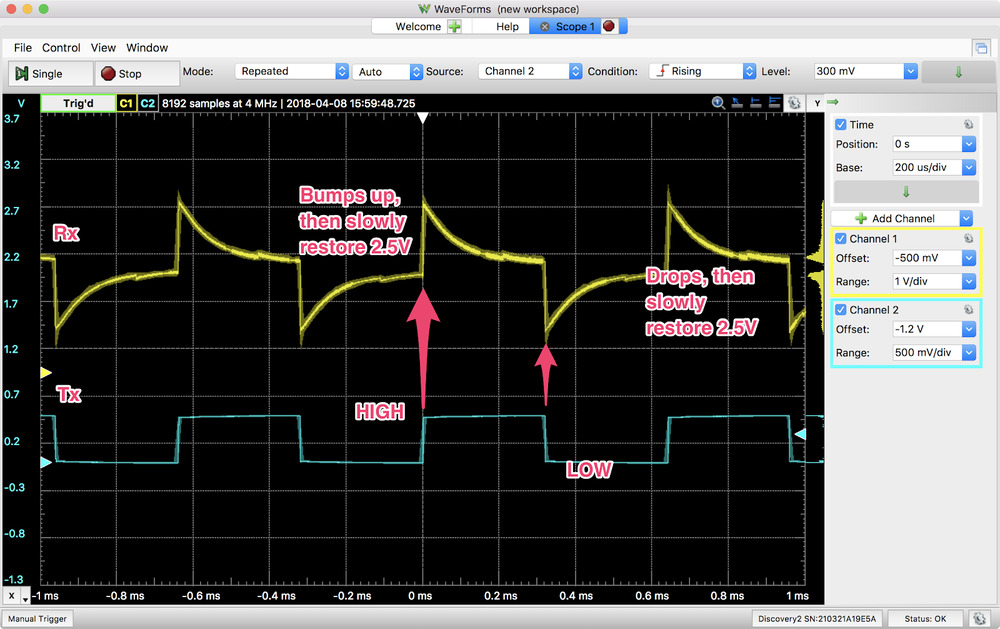
When the Tx set to HIGH, Rx signal bumps up at first but then slowly restore 2.5V which is the original voltage at point A in diagram below.
Then as the Tx set to LOW, Rx drops but gradually stabilise around 2.5V again.
The restoration of the voltage varies depending on the conductive property of two electrodes connected at the end of sensor Tx and Rx lines (Virtual capacitor in the diagram).