
Kati Pitkänen @ FAB LAB OULU · 2018
© 2018 Kati Pitkänen · Template by Bootstrapious

This work is licensed under a Creative Commons Attribution-NonCommercial-ShareAlike 4.0 International License.
Final Project
Spring 2018 · [ 17.1.2018 - ]
- Create your own integrated design
- Demonstrate 2D & 3D modelling capabilities applied to your own designs
- Select and apply appropriate additive and subtractive techniques
- Demonstrate competence in design, fabrication and programming of your own fabbed microcontroller PCB, including an input & output device
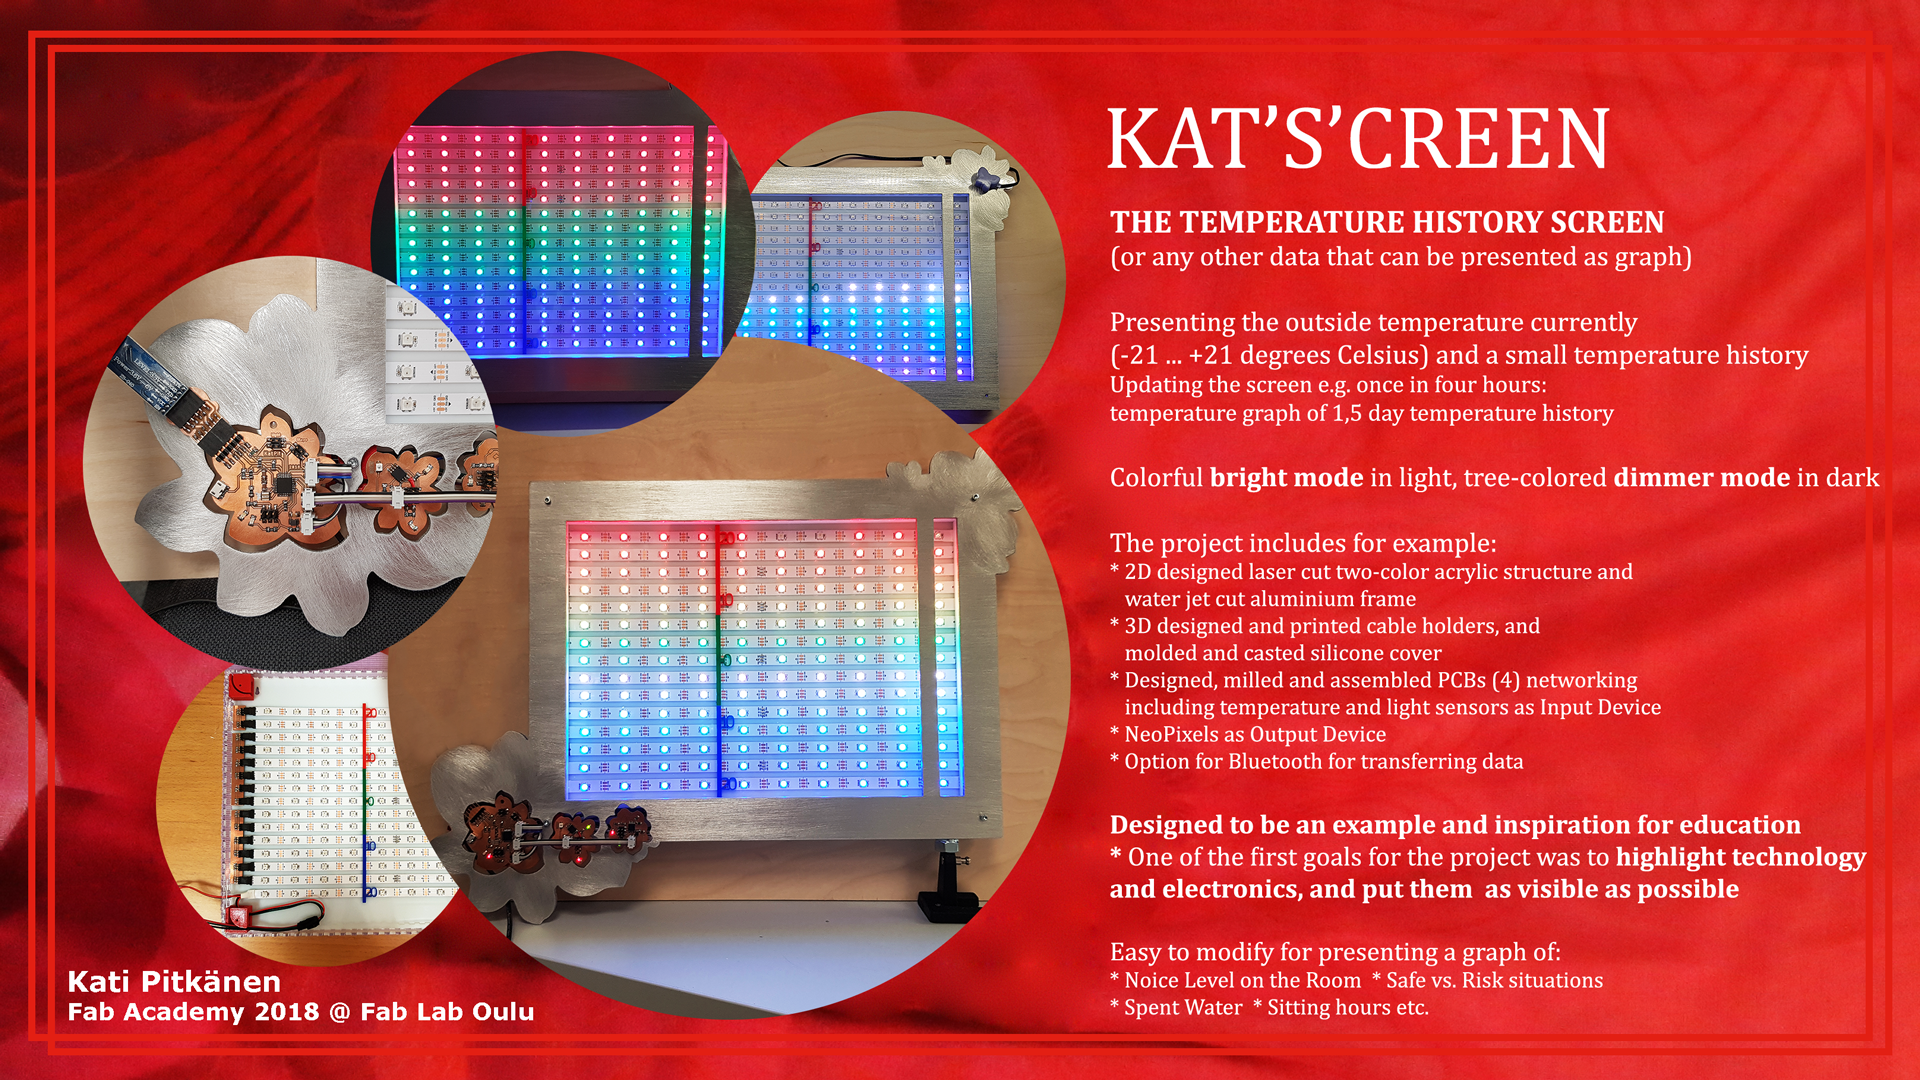
In addition to current temperature, sometimes it is interesting to know, how the temperature varies locally during the day and also during the night - how warm or cold has it been - some people even keep statistics on it.
Therefore, my final project is a temperature graph screen presenting the temperaure outside currently (varying between -18 ... +21 degrees Celsius) as well as a small temperature history. Updating the screen once in four hours provides a temperature graph of six measuring points per day, and with the 10 variables scale, in total one and a half day temperature history graph.

Designing phase
One of my very first thoughts for my final project was that whatever will it be, I would like to highlight mechanism and/ or technology, and keep electronics visible as much as possible. This is because, I am aiming to use this project for education, as an inspiration and example for students and teachers. So I wanted to show everything. I wanted to make visible what is inside the project, how it functions, and what keeps it running, in balance with neat, intentionally, and carefully designed appearance.
Moreover, I want the microcontroller boards to be easy to reach, change, re-program and add new sensor boards on the device for presenting different data in different modes and styles of lightning up the NeoPixels.
For this combination and balance, inside the temperature screen structure, I have attached the cables and boards connecting the NeoPixel strips and and hidden them partially, but still they are partially visible. They cannot bee seen from the frontside but when looking from the sides, top or bottom, it is possible to see what is inside the screen.
In the designing phase, I had several ideas of functions for a temperature meter screen. First, I was considering to include both temperature history and forecast. In addition to that, I wanted to have some figure (butterfly) moving up and down on the temperature scale presenting the current temperature. However, later on, I considered ensuring that I am able to finish my final project. Therefore, I put my effort on careful designing and details.
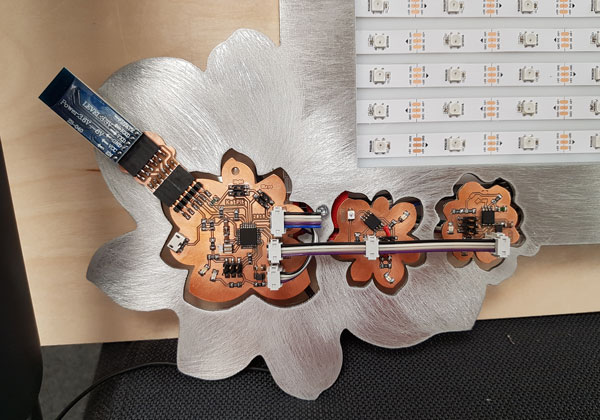
The idea developed further during the weekly processes. I wanted to make the screen look personal, and got inspired to follow the idea of the flower figures I created on the Input designing week for the PCBs I designed.
This idea of the LED graph screen providing some data graph has several future possibilities. By changing the sensors, it can be used also for showing for example noise level on the room and ponting out the moments when the noice is on on critical level and injurious to the ears. Moreover, it can present certain period of safe vs. risk situations.
Here, I will describe how the temperature LED screen functions.
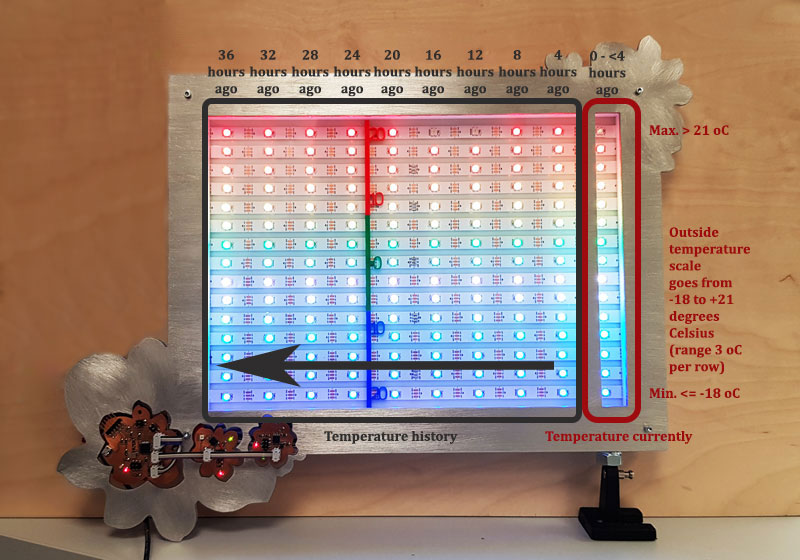
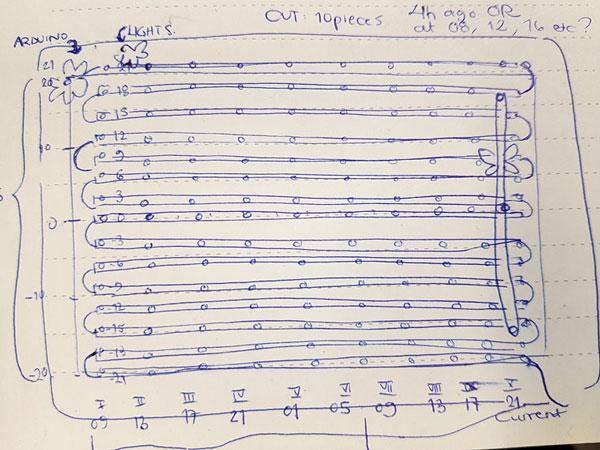
On the most right column of the screen is the temperature currently -column, that presents the outside temperature on the scale from <= -18 ... to > +21 degrees Celsius. In case the temperature outside is -18 degrees Celsius or colder, there will be only the most bottom LED lit up on the column. Each three degrees Celsius will lit up one LED more on the column until the temperature reaches + 21 or greater degrees Celsius.
The most of the LED area is for presenting the local temperature history with its nine history columns. On every four hours, the temperature will be checked again. The new checked value will replace the old present value on the right column, and all the temperatures - "the old present" and the eight most resent history points - will be shifted one step to the left. The ninth history temperature will be forgotten. With this setting, the screen will present 36 hours temperature history updated on every fourth hour.
The additional function is adjusting the lightness of the screen based on the environment brightness. The brightness will be checked on every second loop, so every 10 seconds. When it is bright the screen will function using the normal, daylight mode, where each of the 15 temperature range is assigned to use different, bright color. If it is dark, the screen will change to lit up the NeoPixles in night mode, where the 15 rows on the screen will be divided in the three sections being lit up with three colors only, five rows per each color, using a lot of dimmer colors.
A User does not need to do anything else but connect the power supply on the screen. To fill the screen totally for the first time depends on the time between the checking points. In case of updating the screen every fourth hour, to light up every column on the screen takes 36 hours, which after it will show the full history on the graph.
| FABRICATED PART | WEEKLY ASSIGNMENT | PROCESS | MACHINE AND TOOLS | SOFTWARE |
|---|---|---|---|---|
| The Frame | Week 18 * | 2D Designing and Water Jet Cutting | Water Jet Cutter | Autodesk AutoCAD, IGEMS 9 |
| Screen structure | Week 4 | 2D Designing and Laser Cutting | Laser Cutter | Inkscape |
| User information sticker | Week 4 | 2D Designing and Vinyl Cutting | Vinyl Cutter | Adobe Illustrator, Cut Studio |
| Cable holders | Week 3, 6 * | 3D Designing and 3D Printing | 3D Printer | Autodesk Inventor, Stratasys Insight |
| Silicone cover for temperature sensor | Week 10 | Molding and Casting | Milling Machine | Autodesk Inventor, Moldela, Roland VPanel for SRM-20 |
| Sun shield for temperature sensor | Week 4 | 2D Designing and Laser Cutting | Laser Cutter | Autodesk Inventor, Inkscape (If time) |
| FabTinyISP -programmer (ATtiny45) | Week 5 * | Electronics Production | Milling Machine, Soldering station | Roland VPanel for SRM-20 |
| Bridge board (ATmega328P) | Week 7, 12 * | Electronics Design, Embedded Programming | Milling Machine, Soldering station | Autodesk EAGLE, Roland VPanel for SRM-20, Arduino IDE |
| Temperature sensors, light sensor (ATtiny45) | Week 12 * | Input Devices | Milling Machine, Soldering station | Autodesk EAGLE, Roland VPanel for SRM-20, Arduino IDE |
| NeoPixel graph | Week 13 * | Output Devices | Soldering station | Autodesk EAGLE, Roland VPanel for SRM-20, Arduino IDE |
| ATmega328P + ATtiny45 x2 | Week 15 * | Networking | FTDI-cable for Serial, Sensor Bus for mySerial communication | Arduino IDE |
| Application Programming | Week 14 | Interface and Application Programming | MIT App Inventor | MIT App Inventor (If time) |
* The weekly assignment with the star means, that the process was done during the actual week. The weekly assignments without a star points out the week the process was as a topic but the work related to it is done afterward.
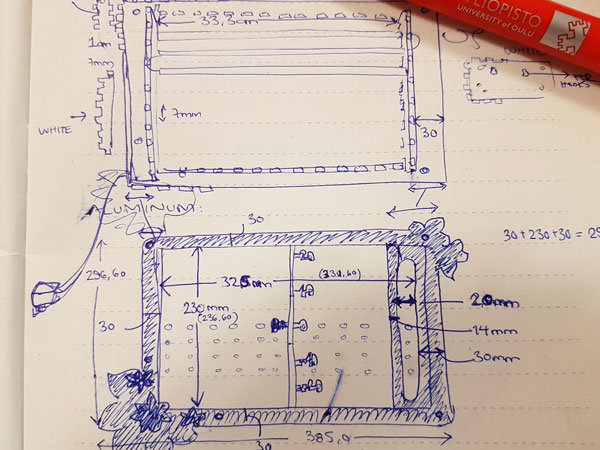
Final sketches of my temperature history screen.
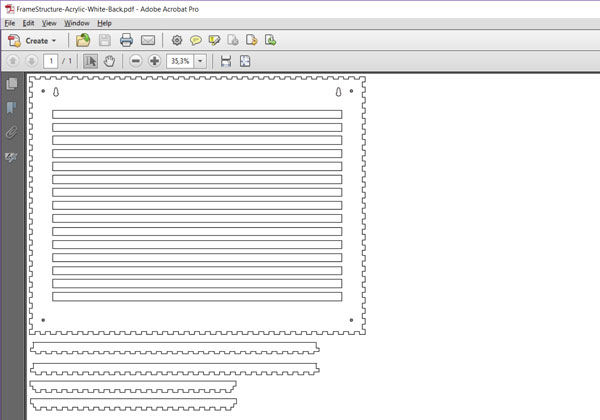
2D Designing and Laser Cutting Acrylic: The bottom and the middle structure of the screen
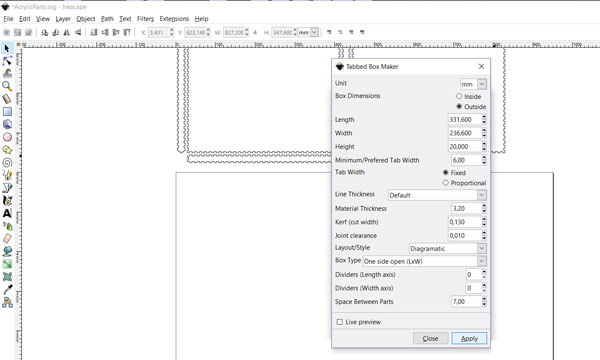
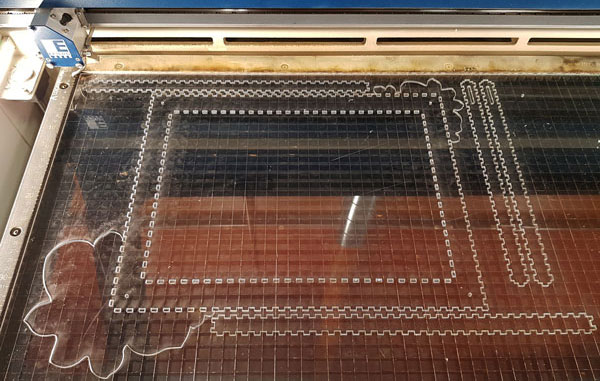
I designed the structure of the LED screen in Inkscape following the basic process documented on the Week 3 - Computer-Aided Design and utilizing the Tabbed Box Maker extension documented on the Week 16 - Mechanical Design to design the screen structure.
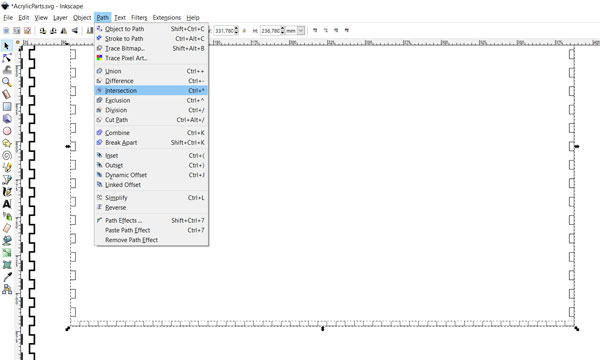
For making the holes on the front screen for middle walls, to frame the visible area of the NeoPixels and hide the cables, I created a tabbed box that had one side open. Then, I made a rectangle with Create rectangles and squares -tool around the box and by using Path > Intersection tool, I had only the holes that I needed for attaching the walls left.
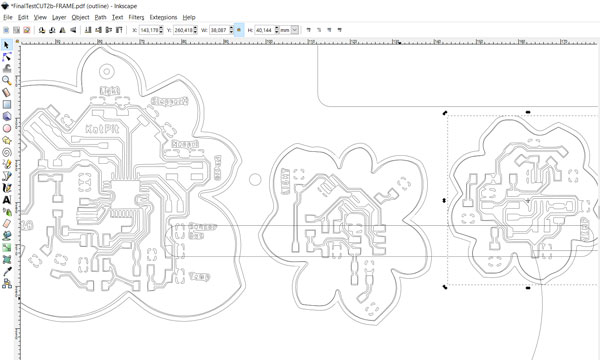
Then, using Adobe Photoshop CS6, I edited the printscreen I took from Eagle board layout file on the Flower PCBs that I had fabricated for the final project on the Week 12 - Input Devices.
I cut the board layout on separate pictures on each of the three Flower -boards. Then, I copy-pasted these pictures to Inkscape, and using Path > Trace Bitmap -tool, I got the outlines of the boards. To place the boards on the frame, I made them a little bit of bigger than the actual boards. Moreover, using the actual size and the outlines of the componen pads, I positioned the holes for boards so, that the serial communication cable would be a short straight line from the board to another.
I created the temperature scale using the same Trace bitmap and Union -tools.
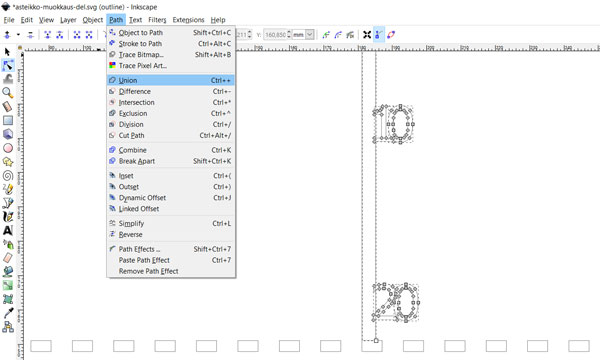
Lastly, I created the outer edge shape. To design the aluminium frame for the Week 18 - Wildcard Week, I utilized the traced bitmap pictures of the Flower boards, and by combining and making Unions with them, I got the shape of the frame. Now, I took that design and placed it above the front side of the tabbed box screen. From the left tool bar, I selected the Edit paths by nodes -tool to delete all the unnecessary vector points from the edges, where the tabs were needed to connect the box structure of the frame, and created the holes on the flower shaped area as described above. Using the spesific Edit paths by nodes > Break path at selected nodes -tool I brake the connection between the flower shaped frame outline and deleted the curves that was left after deleting the vector points. Using Union tool, I sombined these two frame outlines to get the final front side of the screen structure.
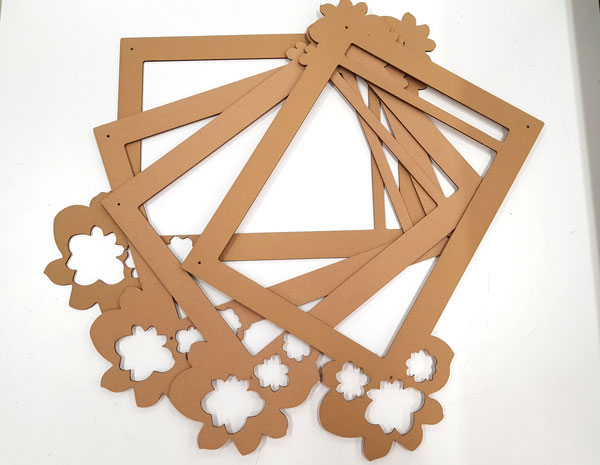
First, I laser cut prototypes using cardboard (width 3 mm).
Here is the first prototype I made. Then I found, that the location of the boards was not the smartes consireding the cables connecting the boards. Otherwise the structure looked pretty functional. Still, it required some more iterations before I was happy with the result.
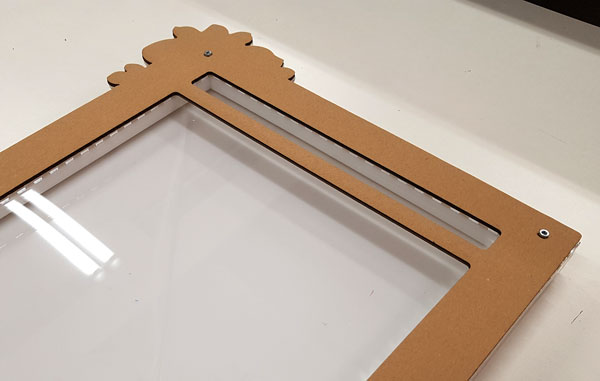
I cut the front screen and the outer structure on transparent acrylic to see the electronics and idea of the screen through it. The inner edges and the bottom structure I cut on white acrylic to soften the background and the white NeoPixels strip attached on it, and to give the maximum focus on the NeoPixels.
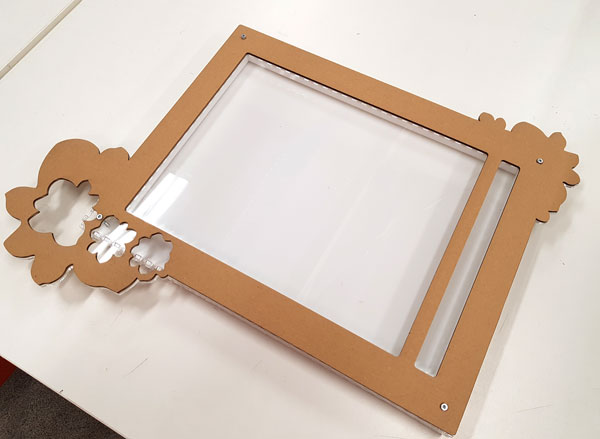
Here is the finished structure of the LED screen, and the cardboard prototype of the aluminium frame attached on top of it.
Water Jet Cutting Aluminium: The front frame of the screen
During the Week 18 - Wildcard Week I fabricated the aluminium frame of my temperature LED screen using a water jet cutter. Detailed documentation on the process can be found from the weekly assignment page.
Vinyl Cutting
Using a vinyl cutter, I fabricated the user information sticker placed with the help of transferring sheet at the backside of the screen. The sticker informs about the correct voltage and recommended current for powering the LED screen. The calculation and explanation of the values is presented later on this page in the context of NeoPixels. However, because "too much" Amps is not that bad, for the sticker I wanted to include a little bit more Amps than actually needed, especially with these first settings, 3 Apms.
The sticker is designed with Adobe Illustrator. The picture of the plug is obtained here, licensed under the Creative Commons Attribution-Share Alike 3.0 Unported License. The documentation on the vinyl cutting process can be found from the Week 4 - Computer-Controlled Cutting -weekly assignment page.
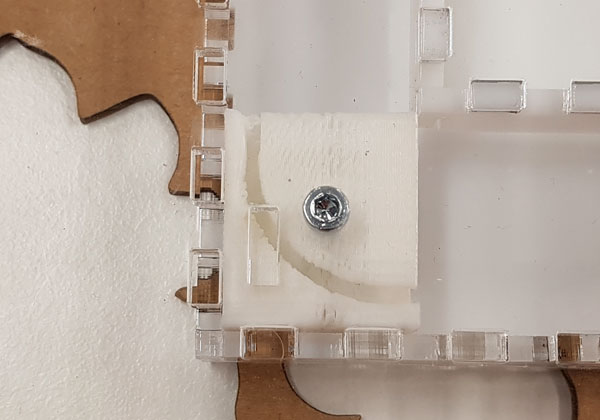
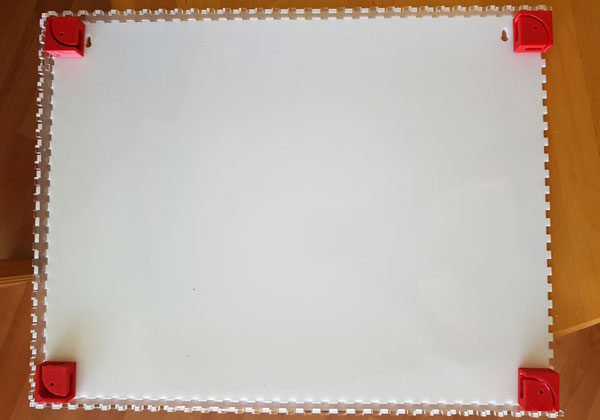
3D Designing and Printing: Cable holders inside the frame
For the Week 3 - Computer-Aided Design I fabricated the cable holders using Autodesk Inventor to design and Stratasys Fortus 380mc to print the objects. Detailed documentation on the process can be found from the weekly assignment page.
First, I tried to use Shindoh 3DWOX, especially because there was a white filament inside but also for experimenting, but since there was continuous problems with the machine, I had to change the printer. Fortunately, I managed to print one part, so I got to test if the design works.
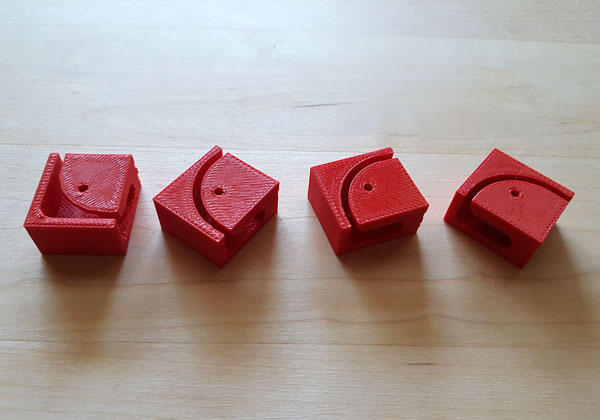
It was not that bad to change the printer when I got to know that there was a red filament available for Stratasys, which would be kind of nice detail since the cable holders will be visible through the transparent side wall of the screen. So, I printed the cable holders as red. I wanted the object be more solid, so I improved the printing settings as well.
The one in the bottom left corner (Cable holder no: 1) differs from others because it is placed under the hole meant for cables coming from the microcontroller boards through the front screen to the outside temperature main board located inside the screen structure. However, it was too bad, that I made one mistake in designing the three other holders. I did not take into account the form of the cable holder, that it was fixed for the corner I originally designed it, and in addition fit to the opposite corner, but not for the other two corners, because the measures of the sides were not egual (the holder is not a square but instead slightly rectangle). Fortunately, what comes to holding the cables in the end, the two crucial corners succeeded. So, for saving the material I did not print the other two again but decided just to rotate them 90 degrees to fit with the screw holes and look nice on the corners.
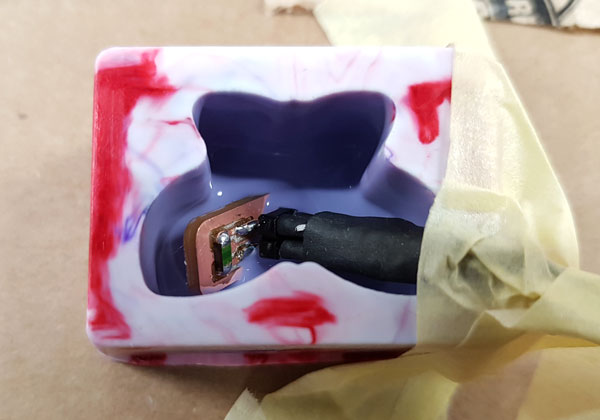
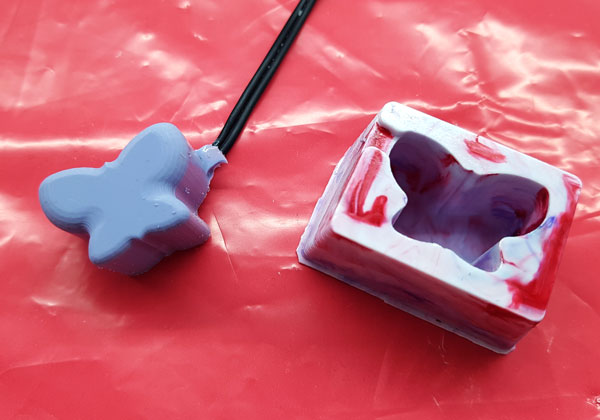
Molding and casting
Following the process documented on the Week 10 - Molding and Casting, I designed and fabricated a silicone rubber cover for the outside temperature sensor board. The only difference for the process done earlier was, that this time I made opposite process. This time, I made a negative mold out of a liquid plastic for being able to cast a silicone rubber on that mold. I could have done only the positive wax mold and cast silicone straight through in there but I wantd to repeat the process to remind me about it and to cast also a silicone mold for future purpose.
Milling the mold for sensor board did not work in a first run, because the mold was so depth that from the one edge, the design came a bit trough on the bottom because there was another depht mold on another side of the wax block. However, casting a liquid plastic went fine and the mold having good slant angles toward a bottom was very easy to remove from the wax block using two screws and a hammer.
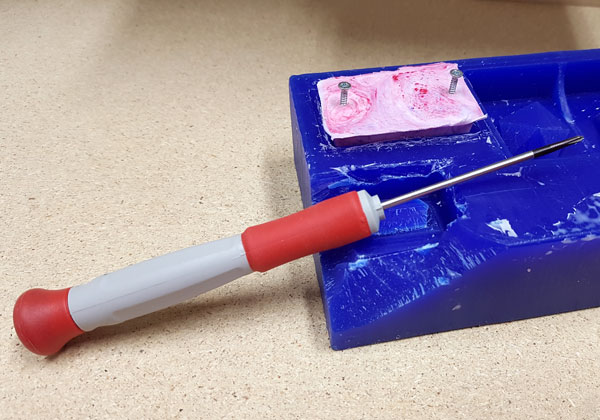
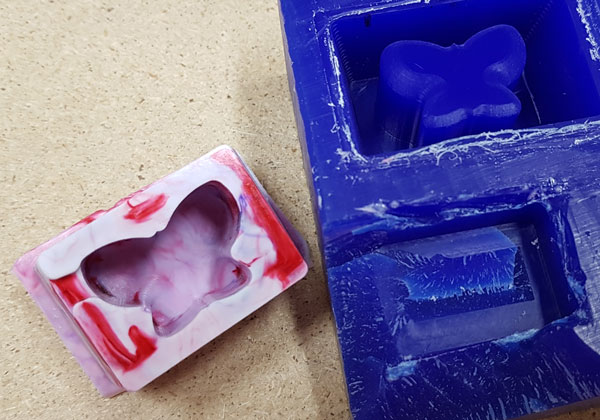
Casting the cover for NTC sensor board succeeded perfectly. There is not even a single edge where the board could be seen through the wall but it really is fully covered by the silicone rubber.
Designing and Fabricating Electronics
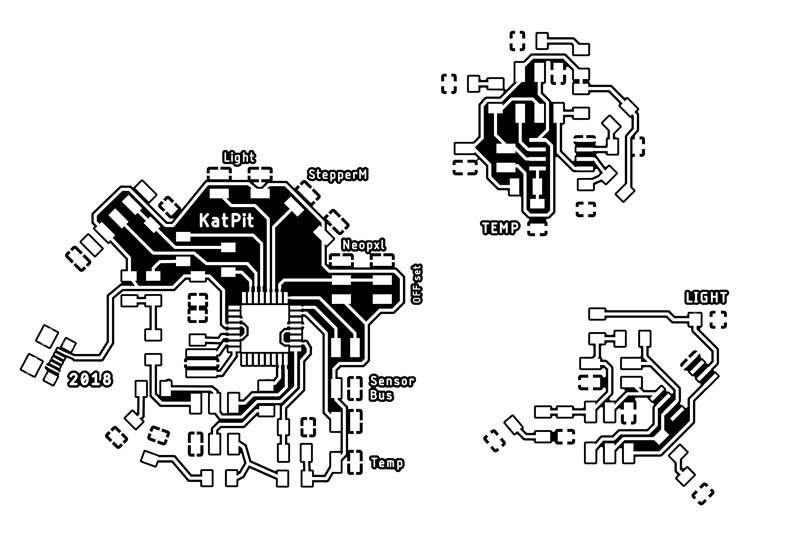
On the Week 12 - Input Devices, I designed and produced the boards for the final project with Autodesk Eagle 8.6.3:
- A Flower-shaped Main board (ATmega328P) // Bridge
- A Flower-shaped Light sensor board (ATtiny45) // Node 1
- A Flower-shaped Temperature sensor board (ATtiny45) // Node 2
- An Outside Temperature sensor board (two-piece) // Input Device
The ATmega328 board has a micro-USB connection for powering the board and the whole product including the NeoPixels. In addition to FTDI TX and RX pins, the ATmega328 board has a separate SENSOR BUS connection for networking with ATtiny45 sensor boards.
Thus, the ATmega328 board:
- Functions as a main/ bridge board connecting the ATtiny45 Node boards for networking.
- Receives and calculates the temperature data measured with a separate outside temperature board for presenting it with the Output Device: NeoPixels.
- Requests the information of the environment brightness from the ATtiny45 Node 1 -board through serial communication line for adjusting the brightness mode of the NeoPixels - In light: colorful, bright mode, In dark: three-colored dimmer mode.
Later on, I will add also the ATtiny45 Node 2 -board to the network for measuring the inside temperature. In that case, the Bridge board will receive and transmit the request from the mobile device application through Bluetooth connection to the Node 2. Then, it will receive the data from the Node 2, make the calculation of the temperature on ATmega328 own memory because of the memory limit on the ATtiny45 and furthermore, transmit the information through the bluetooth connection back to the application.
This is why I wanted to prepare the ATmega328 board for Bluetooth connection. Our local instructor Antti Mäntyniemi helped me in understanding what was needed to realize this. By his advice, I added a voltage divider to connect a HC-06 (ZS-040) bluetooth module, that is a 3.3V device, to a 5V ATmega328 via FTDI connection. I created this voltage divider using two resistors: one 2K ohm and 1K ohm resistors between its ATmega328 TX and FTDI RX pins.
"The HC-06 breakout board has a 3.3v regulator that allows a larger input voltage to be used, in the range of 3.6 to 6 volts. The RX pin can still only accept 3.3V though. --- The Arduino will read 3.3V as a HIGH so the HC-06 TX pin can be connected directly to the Arduino." (Martyn Currey: Arduino and HC-06 (ZS-040))
Detailed documentation on the decisions and the process of designing and fabricating electronics can be found from the weekly assignment page.
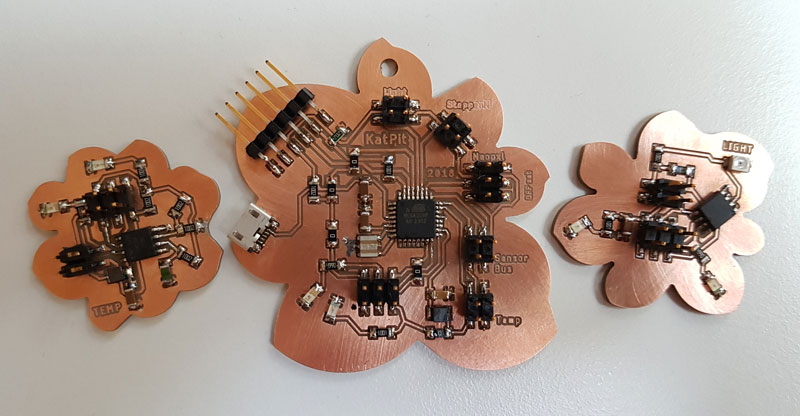
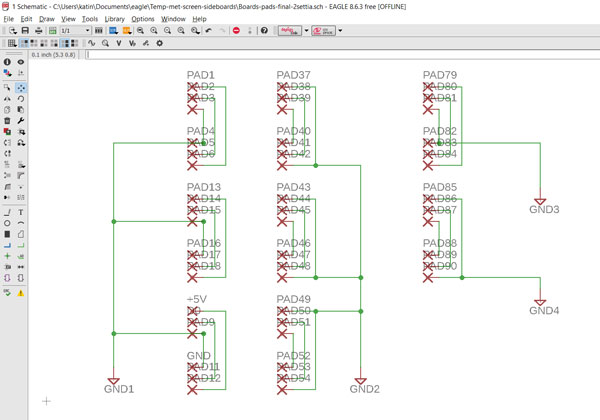
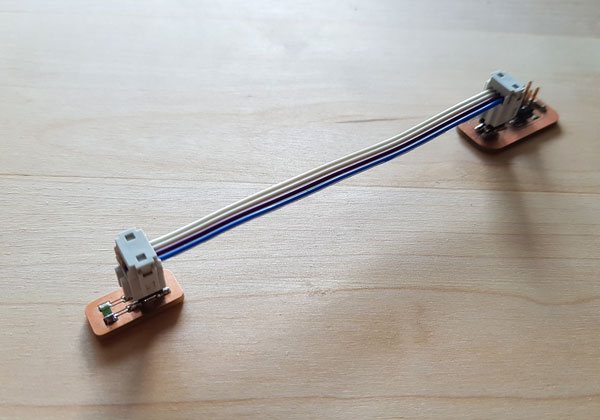
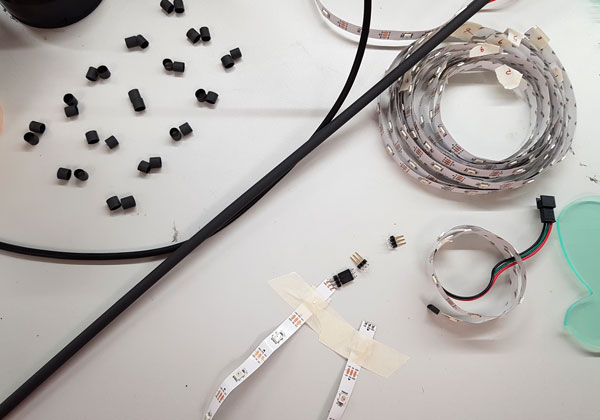
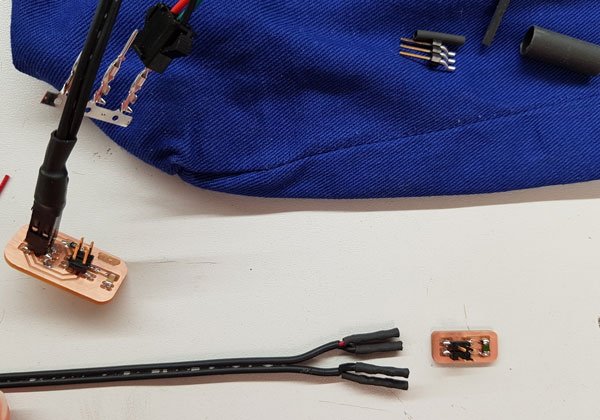
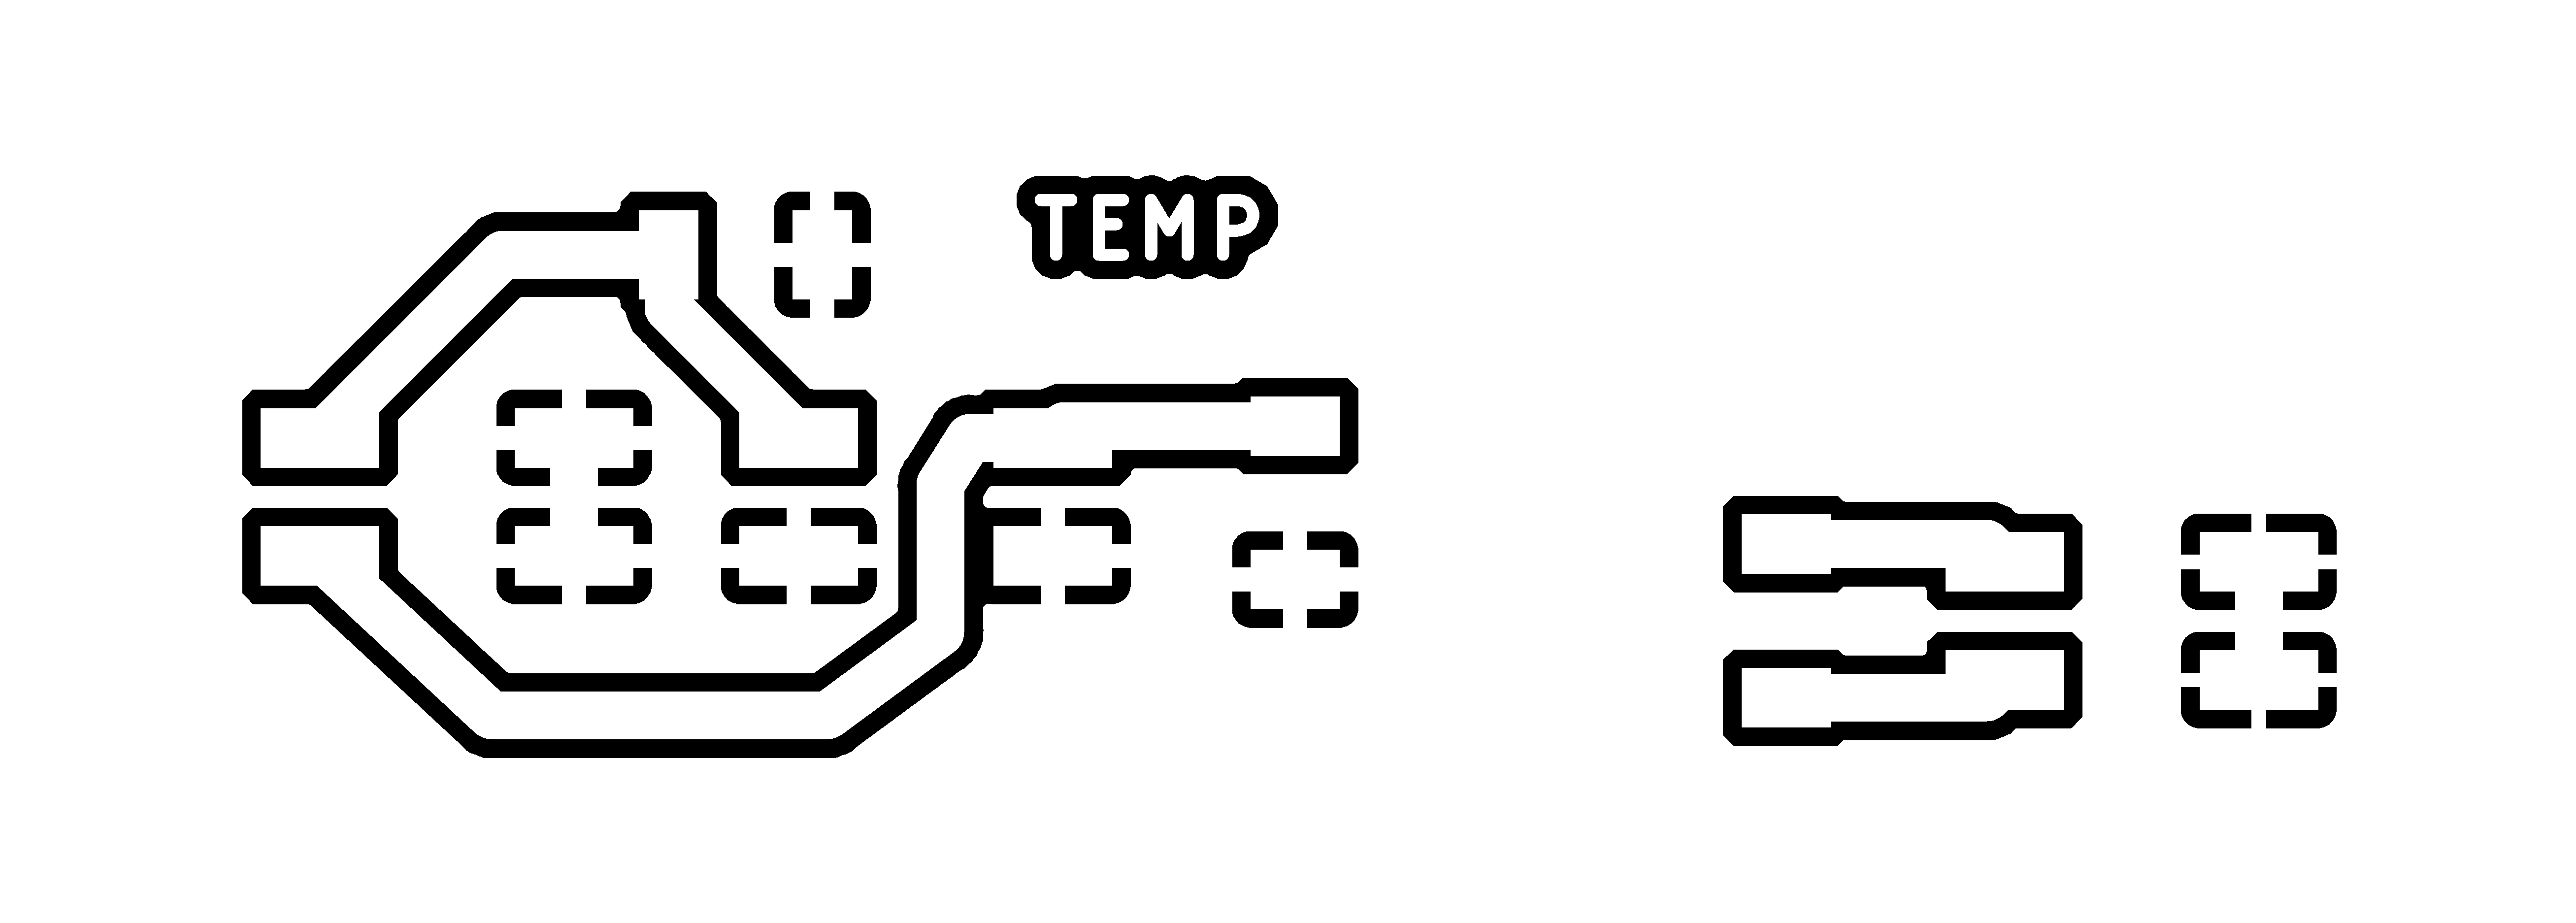
Following the Week 12 documentation, I designed and fabricated also the boards, involving a line for groung, signal and power, for joining the cut NeoPixel strips together. I was not able to found surface mount 1x3 pin header component, but I found single pad from the wirepad -library > SMD2/ SMD PAD, 1,27-2,54 mm so I made the pads using this one. The measures I got by utilizing one 2x3 header as an example to give correct distances.
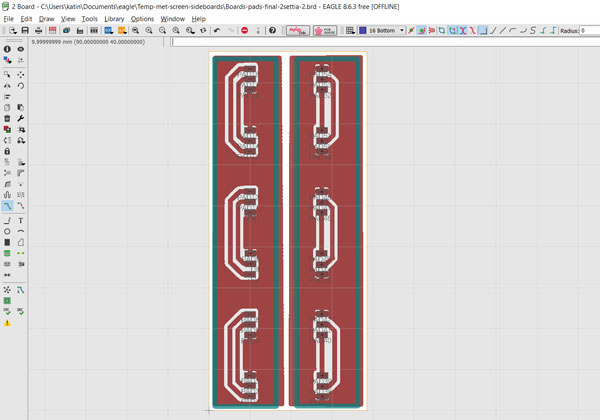
First, I designed all the pads on the same schematics, because I wanted to mill them in one go. However, even the design was smaller than the PCB, the Mods that I used for generating the toolpaths for milling, did not make it but left some parts wihtout cut. I had to split the design of 14 connectors in the two separate design files including eight in one and six connectors in another.
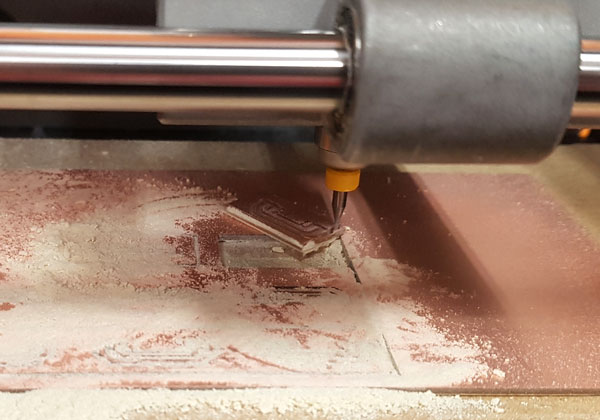
Next, I faced challenges in milling. Even I taped the PCB on the plate of the milling machine very carefully, such as documented on the Week 5 - Electronics Production, for the first time it came unstuck in the middle of cutting. The issue was fixed by taping both the PCB and the plate with the masking tape, and then qlueing these two taped surfaces together using super glue. It worked very well.
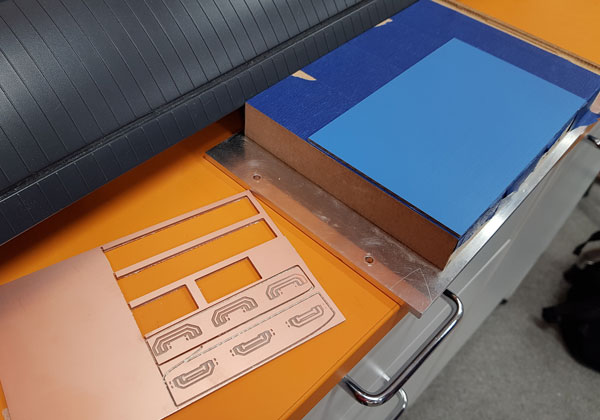
I attached the boards on the backside of the LED screen with double-sided tape. Then, I soldered the legs of the NeoPixel strip connectors on the side boards.
Originally, I designed the boards so that they would have touched each other. But because of the size limitation faced in Mods, I had to decrease the size of the boards to fit even three connector pairs on the same row on the PCB. So, I had to accept the small space between the boards.

For future development, I prepared also a small PCB connector connecting the Bluetooth modude on the bridge board (ATmega328). Using this connection and application on my mobile phone created for example with MIT APP Inventor 2 I can transfer some data from the sensors.
Input Devices: Temperature sensor and Light sensor
During the Week 12 I worked with the temperature sensor aimed at measure the outside temperature being the input of my LED screen. Further, I worked with the light sensor being the second input on my project, sensing the brightness of the environment for dimmering the NeoPixels in dark, and brighten them in light.
After the week, I had my temperature sensor boards tested and the code prepared for measuring the environment temperature. Detailed documentation on the process can be found from the weekly assignment page. I used the same code as a baseline to program the NeoPixels lit up based on the temperature range.
For measuring th outside temperature, I am using a sensor board without microcontroller, and putting outside of the window only the tiny external PCB that has no more components, than the NTC thermistor and the pin header to connect the PCB to the main board of this two-piece set temperature sensor board.
Later on, for future development, I will use the second ATtiny45 sensor board on the frame through the serial communication network for measuring inside temperature.
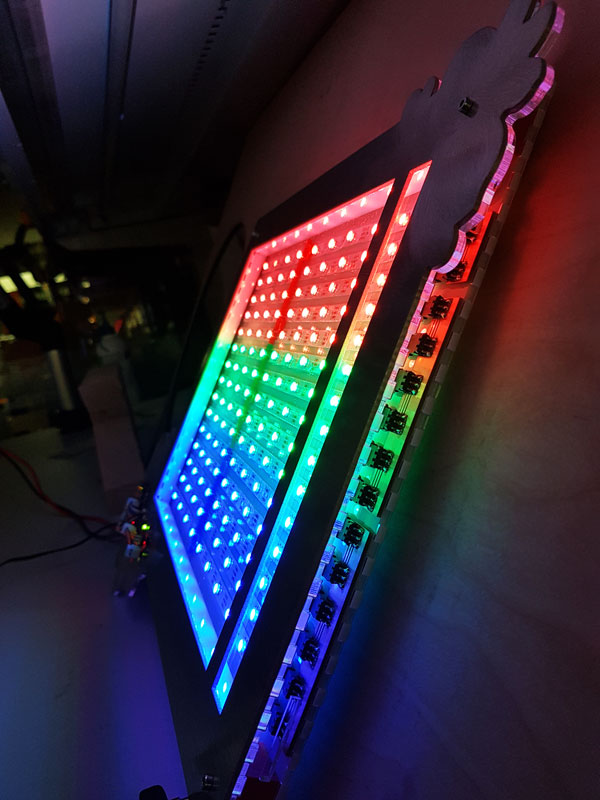
Output Devices: NeoPixels
During the Week 13 I worked with NeoPixels and tested the very initial coloring of my temperature meter colors for the LED screen.
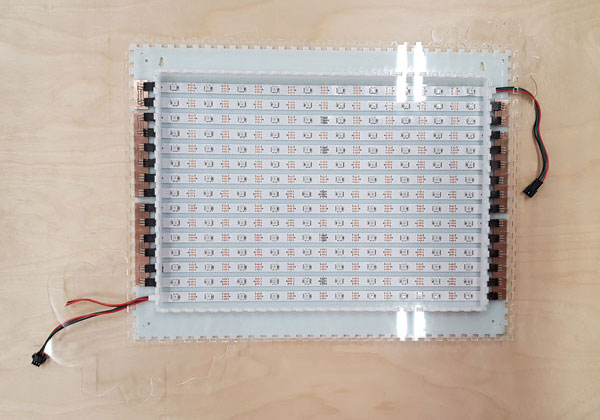
The NeoPixel strip is digitally-addressable type of LED strip. There are 30 RGB LEDs per meter, and five meters in total, and I will control each LED individually.
The strip that I use (WS2812B 5050) has following technical specs 1 / 2:
- 30 LEDs per meter
- 1 integrated RGB LED per segment, individually controllable
- Maximum 5V @ 60mA draw per 1.3" strip segment (all LEDs on full brightness)
- Voltage: 5VDC power requirement (do not exceed 6VDC) - no polarity protection
- Power: 0.3W ± 0.01% per LED
- LED wavelengths: R 620-630nm/ G 515-530nm/ B 465-475nm
- Color: full color 24-bit
- Light source: 5050 LED
- Waterproof: non-waterproof IP20
- Dimension: 5000 x 10 x 3mm
- Life span: 50000 hours
- Datasheet WS2812B
More over, I calculated an estimation of the power requirement to power my NeoPixel strip of 5 meters and 150 NeoPixels. Detailed documentation on the process can be found from the weekly assignment page.
In case, they all should be able to light up bright at the same time (with the 1/3 at maximum brightness white (red + green + blue)), the power requirement would be as follows:
- 150 NeoPixels × 20 mA = 3 Amps minimum
However, the brightness of the NeoPixels is very bright, there is no need for that much light in my project. This is why I considered to reduce the brightness to 1/4. This means, that the power requirement would be:
- 150 NeoPixels × 15 mA = 2.25 Amps minimum
Therefore, I considered using a power supply of DC 5V 3A for my temperature graph screen.
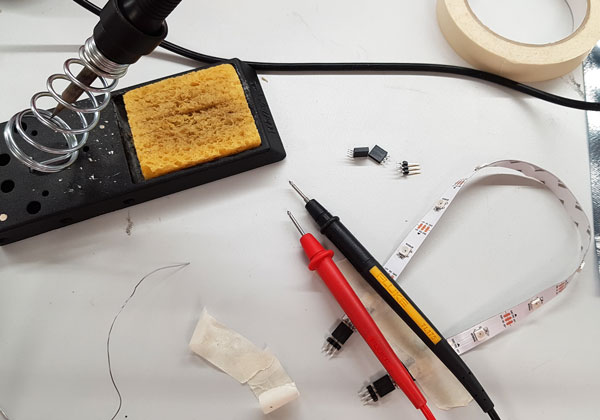
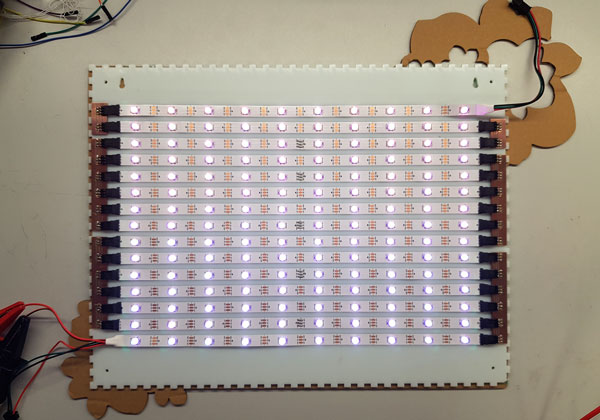
I cut the five meter/ 150 NeoPixels strip in 15 pieces of 10 NeoPixels in each. For insulating and finishing the joints, I cut 28 pieces of heat shrink tubing, diameter 10 mm, in length ~8 mm. Then, I added a piece of heat shrink tubing in each of the NeoPixel strip end before soldering the connector on the end. For soldering, I used a piece of masking tape to hold both the strip and the connector still.
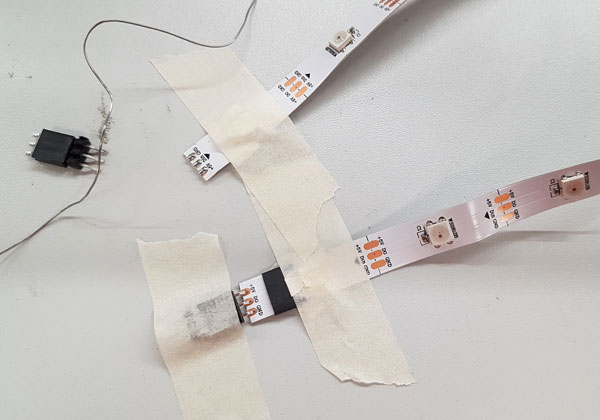
After soldering the strip, I immediately checked that the connections and continuity between the ends was fine. I was a little bit afraid of heating the NeoPixels too much, but in the end, fortunately, soldering was easier than I thought.
To prepare the heat shrink tubing, I heated up the pieces using a heating gun of a temperature 100 degrees Celsius.
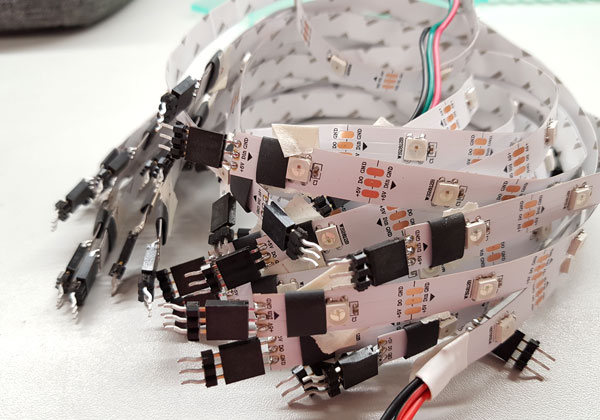
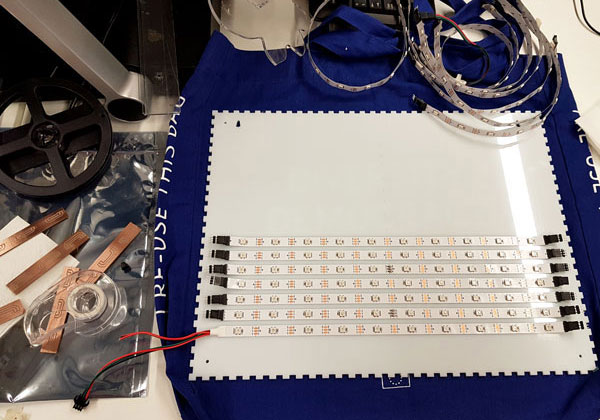
After the strips were prepared, I was ready for attaching them on the back wall on the LED screen. The lines I engraved on the wall (slightly thinner than the strip itself so they will not be visible after the strips are attached), were very helpful for attaching the strips in straight line and having identical spacing between them. However, I had challenges in attaching the strips as I described on Week 21 - Project Development page. I tried two different, thin double-sided tapes (the better, the thicker tape was not suitable for this purpose), but everytime the tapes were ripped of either from the acrylic or (mainly) from the very slippery strip surface. In addition to changing the tape, I tried super glue and sanding the surface of the acrylic to make it more rough. Finally, I got the best results in combining sanding, and both the tape and the super glue.
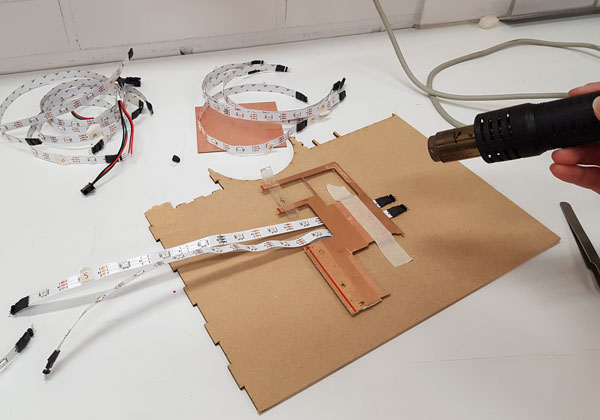
I attached the strips one by one with the including double-sided tape on back of the strip. Then, I attached the boards for the strips using double-sided tape, as well. The male headers were slightly too long for the female connetors, so I cut them with side cutters to make them fit perfectly.
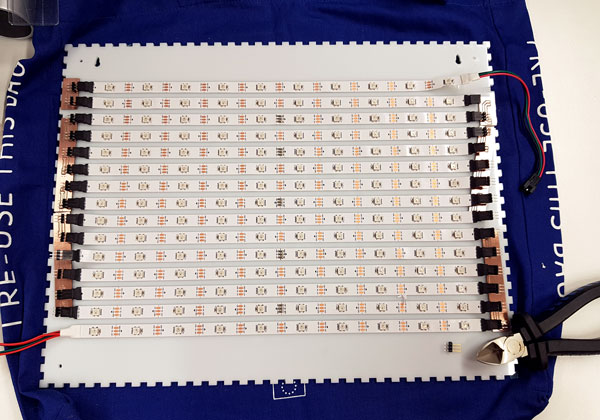
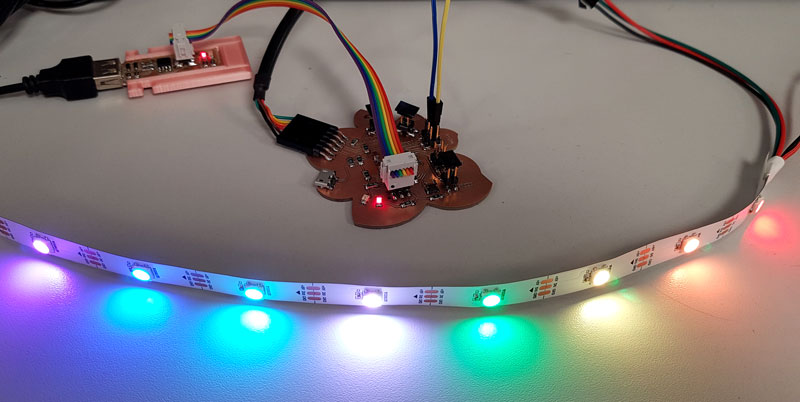
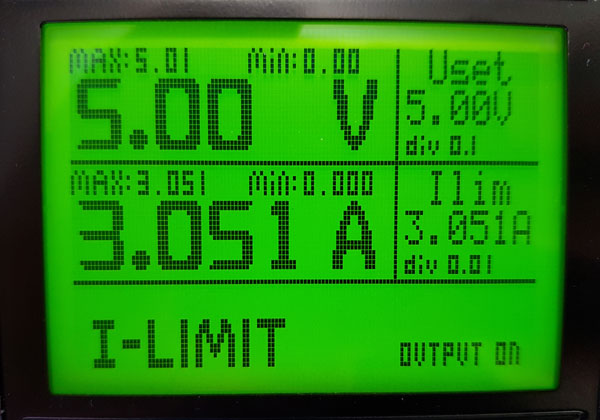
Finally, it was a time to test the assembled NeoPixel strip screen. First, I checked the continuity between the strips one more time.
Then, I adjusted the voltage to 5.00 Volts and limited the current to 3.051 Amps. I started from the lower values of Amps but the color of the NeoPixels - as well as the I-LIMIT on the working station screen - indicated that there was not enough power for all of the 150 NeoPixels to lit up bright. Actually, the maximum power the white NeoPixels would require would have been 9 Amps [150 NeoPixels × 60 mA ÷ 1,000 = 9 Amps minimum].
Anyway, I was super happy to see, that everything works as expected - the PCB:s worked as should, and all the NeoPixels were fine after cutting, attaching, and soldering. GREAT!!
I prepared all the cables carefully using a crimping tool, connectors, and heat shrink tubing.
Network and Programming
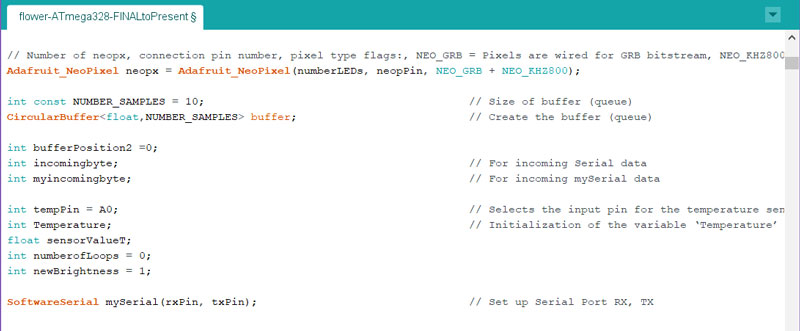
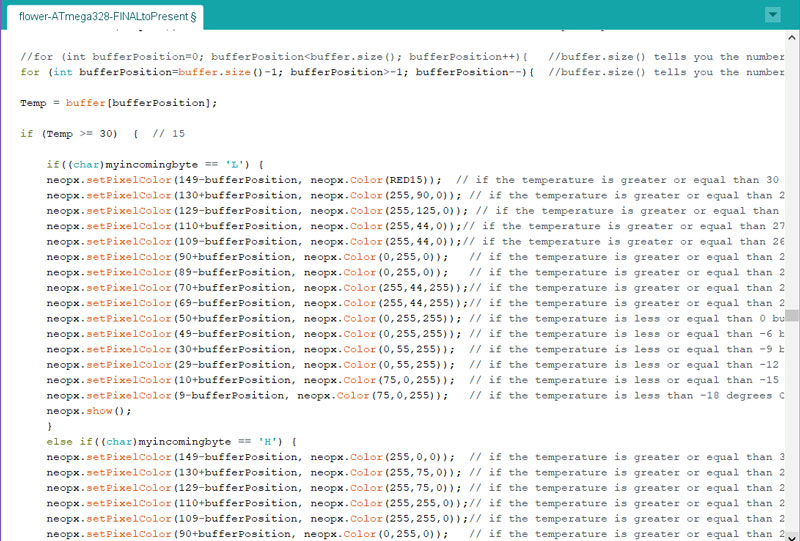
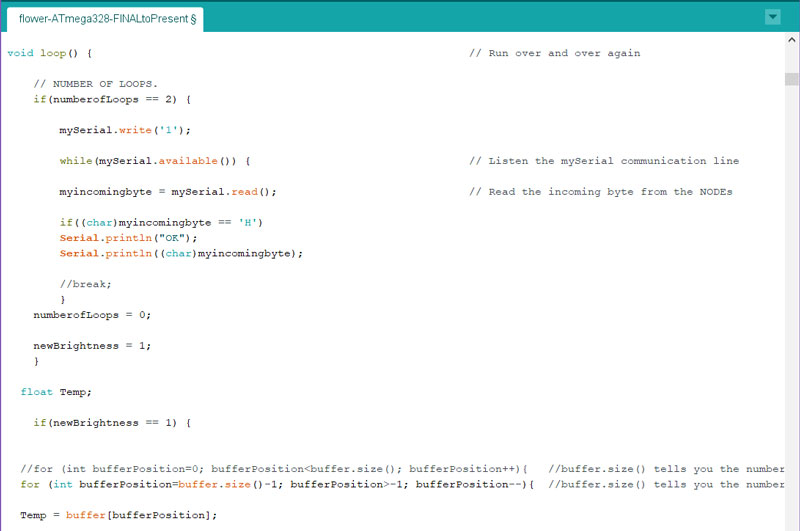
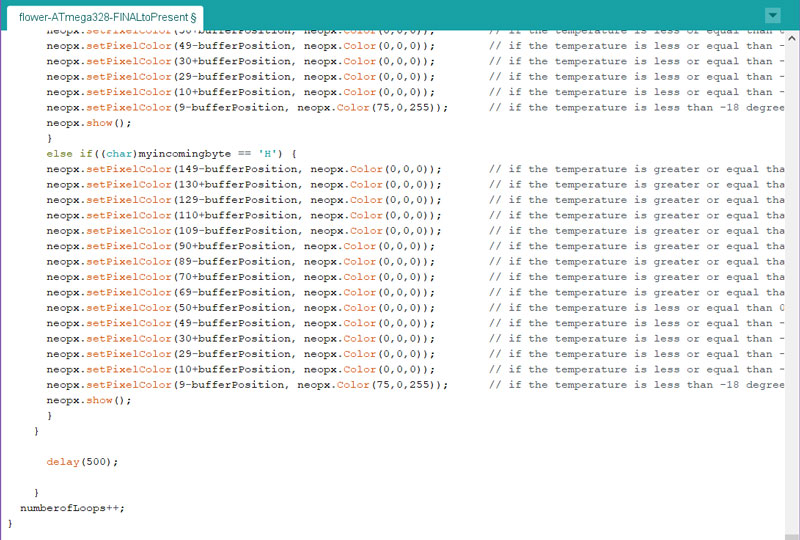
During the Week 15 I worked on establishing a network between the boards and programming the functions of each board: one bridge and two node boards. Here will be presented the final codes and network.
There is 10 measuring points/ columns on the LED graph screen. The most right one separated to its own column is for temperature currently outside. The nine columns on the left are for temperature history. Originally, I was going to light up only 10 NeoPixels at the same time - one per each measuring point/ column - with the maximum brightness white (red + green + blue). However, when I powered the screen for the first time and saw the beauty of the colors and number of NeoPixels together, I change my mind to have them all on the board.
For making the code, I have utilized as a baseline for almost all the codes I have been testing in my weekly assignments on the:
- Week 12 - Input Devices // Programming ATmega328 as a main board, Measuring with Temperature sensors and Light sensor as Input Device
- Week 13 - Output Devices // Controlling NeoPixels as Output Device
- Week 15 - Networking and Communications // Establishing a network between the boards
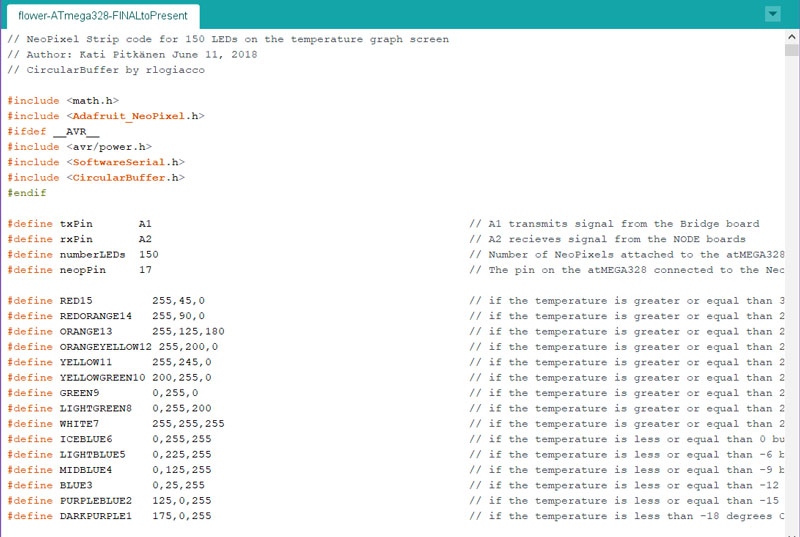
First, I made a table of the NeoPixels on the strip. This is the structure of my NeoPixel strip and the screen orientation indicating the place of each NeoPixel, which will helped me in coding and addressing each LED in certain horisontal and vertical line and define a color in which each NeoPixel will be lit up.
![]()
Then, I started to create a code for the ATmega328 Bridge board for measuring the outside temperature (using a separate two-piece NTC sensor board), utilizing the code I worked on the Week 12 - Input Devices. I utilized the calculation from analog values to digital degrees Celsius made by my fellow student Ari Vuokila. For this, I had to include the math.h library.
Next, I prepared the temperature ranges to light up certain NeoPixels in the temperature currently -column starting from the bottom, based on the temperature value. The NeoPixels are lightning up in certain colors based on the temperature, which for I utilized the code and the initial colors prepared on the Week 13 - Output Devices using the code of NeoPixel Ring simple sketch made by 2013 Shae Erisson as a baseline. At this phase, I included Adafruit_NeoPixel.h -library to my code.
At this phase, I was too far away from the more brilliant algorithms that could shorten the final code for sure, but I am very happy that in the end the code is working and performing the action that was the goal. The next goal can be learning to make the code more effctive with less lines on it. However, I managed to make some declaring and variables to the code, that will shorten it and later on, make possible modifications quicker just by chancing the value of the variable / integer, such as declaring the names of the NeoPixels in the rows light up in certain color.
After this, I faced challenges in figuring out how to make the shifting from the temperature currently to store it and present it in total nine history spots on the graph. I am super grateful for my fellow student Marta Cortés Orduña as well as our local instructor Iván Sánchez Milara who were willing to help me in figuring out this challenge. With the help of Iván I got to know Arduino circular buffer library which seem to be perfect for my purpose for buffering the temperatures.
However, since I don't have that much experience on programming, it was a task to understand what should be done next. This is why I am very thankful to Marta, who generously shared her knowledge and explained me what should be done, and why, what are the phases on the loop and how should they be formed appropriate. Thanks to her help and explanation, I was able to implement the program that I dreamed of so that I also understand what is going on the code.
The next challenge was in combining the conditions. I understod the idea fully, but I made a mistake in setting the conditions first. Marta adviced me of the relation between the ifs and ands which made the code work as should.
Moreover, for including the light sensor in the loop, Marta helped me to form the numberofLoops to count the times, when the Bridge board will ask the value of environtment brightness on the Node 1: ATtiny45 light sensor board.
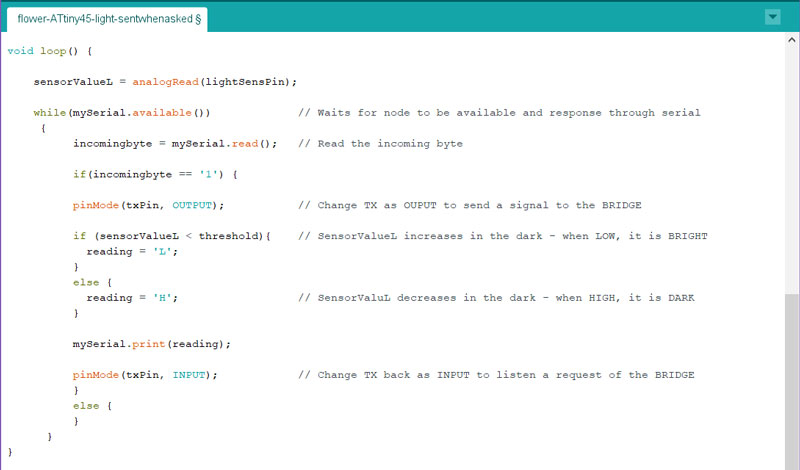
For the Node 1: ATtiny45 Light sensor board itself, that is networking with the ATmega328 Bridge board, detects the lightness of the environment. If the lightness is higher than the threshold value 200, the board will light up a LED. The code is the mix of this simple example Arduino Light sensor code created by AR Builder and the threshold code above for detecting some cut poin which changes the action and response of the board.
For networking, utilized this code mentioned above as a baseline, and I made only a few modifications to the network code obtained originally from my fellow sudent Jari Uusitalo whichI modified for my purpose on the Week 15 - Networking and Communications. The main modification for this code for the final project was in selecting what data to sent. I defined to have one threshold value 200. (When it is bright, the voltage is smaller and vice versa, when it is dark, voltage increases.
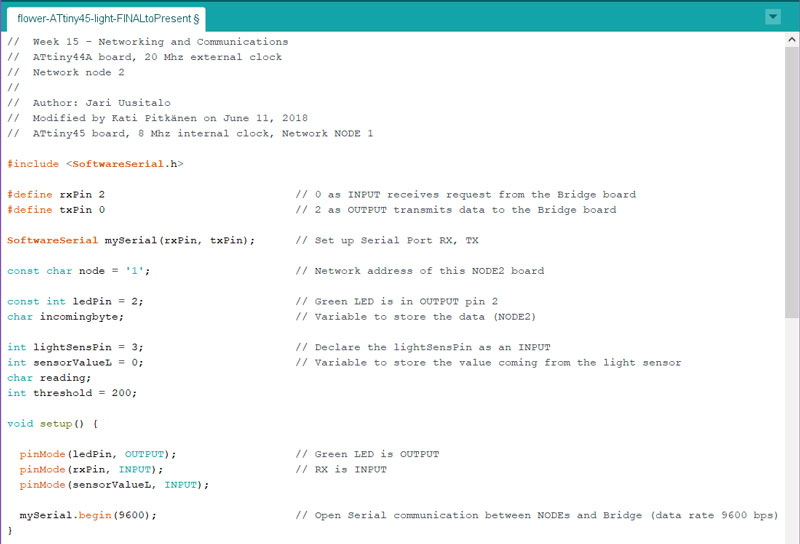
When the Bridge board is requesting, this Node 1 -board will send only the value 'L' - LOW for light or 'H' HIGH for dark.
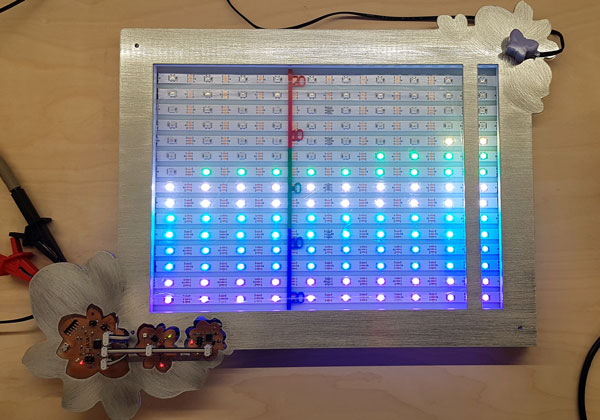
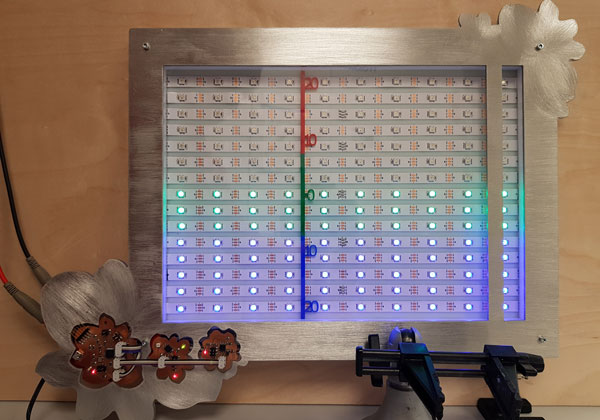
The functions of the temperature LED screen
The main function of the temperature LED screen is presenting the temperature changes locally. For that, the outside temperature sensor board is measuring and sending a temperature value to the Bridge -board that is lightning up certain amount of NeoPixels on the temperature currenty -column on the most right.
In the first picture, the temperature is currently and has during the four previous measuring points been on the range of 0 <= ... < +3, and before that on the range of -3 <= ... < 0. Moreover, the light sensor is sensing that it is bright (the value is less than the threshold value 200) so the output is in colorful light mode.
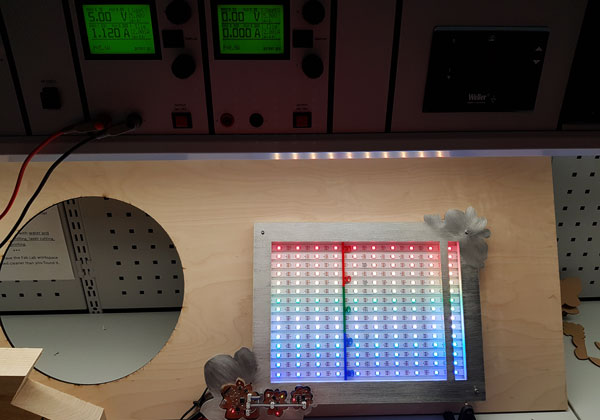
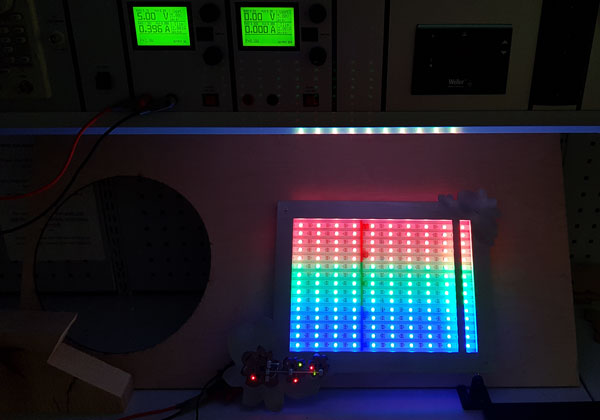
In the second picture, the measured temperature is currently and has been on the nine previous measuring points > + 21 oC. The light sensor is sensing that it is dark (the value is greater than the threshold value 200), so the Bridge -board changes the lit up mode to dimmer, three-colored mode. This mode decreases the power consumption on the evening and night time.
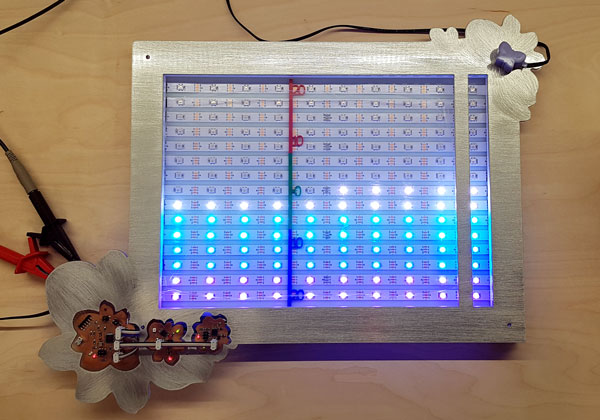
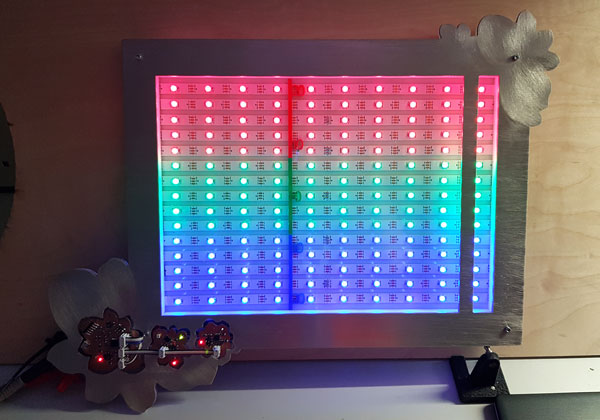
Here, as the history graph in the first picture is providing the information, the temperature has been a little bit higher and it has increased during the checking points from 0 <= to < +12 degrees Celsius. In the second picture, the screen is lit up in dimmer night mode ,and the temperaure has been between +0 <= ... < +3 degrees Celsius during the last 10 measuring points.
The first codes are programmed for Final Presentation use. There, actual updating time of the screen, one loop, is only five seconds. Moreover, the values of the temperature is scaled for inside temperature at this point. After the presentation I will continue and program the boards have the actual settings.
Lastly, I was interested in about the power consumption the two modes will take in maximum. Here the both modes are fully light up, using the brightness of 1/4 of the maximum (max 15 mAmps per NeoPixel).
- The daylight mode, with this color setting, takes maximum 1.120 A, and the power needed is 5,6 W (Watts).
- The dark mode takes 0,396 A, and the power needed is P = 2,0 W.
Bill of Materials
The total cost of the product is 103,71 $, where the most expensive parts are:
- Acrylics 18,61 $
- Adafruit NeoPixel Strip 18.54 $
- External power supply 11.58 $
- Aluminium 8.16 $
| MATERIALS AND COMPONENTS | DETAILS | QUANTITY | COMES FROM | UNIT PRICE | TOTAL COST |
|---|---|---|---|---|---|
| Acrylic | Clear 3 mm | 600 x 400 mm | Nettilasi.com | 37.50 €/m2 = 9.00 € | 10,50 $ |
| Acrylic | White 3 mm | 400 x 400 mm | Nettilasi.com | 43.50 €/m2 = 6.96 € | 8.11 $ |
| Aluminium | 2 mm | 500 x 400 mm | Machineshop, University of Oulu | 7.00 €/kg, 1000 x 2000 mm = 11 kg | 8.16 $ |
| Filament | PLA | 6m/ 18g/ 24,3 cm3 | Fab Lab Inventory | Refill filament 700g for 3Dwox 49.99 $ | 1.29 $ |
| Adafruit NeoPixel Strip | WS2812B White | 5m (30 per one meter) | Stock87 | 15.90 € | 18.54 $ |
| NeoPixel Strip Connectors | In between every cut | 29 | Fab Lab Inventory | 4.00 € | 4.66 $ |
| Heat Shriking Tubing | Flexible 3/64in x 4ft Black | 22,4 cm | Digi-Key | 1.05 $/ 4ft | 1.19 $ |
| Flat Microphone Cable | Stereo Cable | 7 m | SP Elektroniikka | 1,50 €/ m | 12.36 $ |
| Bolts, Nuts, ans Washers | 3 mm | 4x each | Fab Lab Inventory | 1.00 € | 1.17 $ |
| Sanding Paper | Of grit size: 80 | 10 cm | Machineshop, University of Oulu | 0.10 € | 0.12 $ |
| Smooth-On Smooth-Cast® 305 Liquid Plastic | Silicone Mold Making Rubber | 1 | eBay | 32.95 $/ pack | 1.53 $ |
| Smooth-On OOMOO™ 30 Silicone Rubber | Silicone Mold Making Rubber | 1 | eBay | 24.99 $/ pack | 2.00 $ |
| External Power Supply | DC 5V 2 Amp | 1 | 9.90 € | 11.58 $ | |
| ALL TOGETHER | 80,21 $ |
| COMPONENT | DETAILS | QUANTITY | FOR | COMES FROM | UNIT PRICE | TOTAL COST |
|---|---|---|---|---|---|---|
| PCB FR-1 | Single side circuit board stock (phenolic paper) | 1 | A Sheet to mill the boards | Fab Lab Inventory // USA | 1.40 $ | 1.40 $ |
| ATmega328 microcontroller | ATmega328P-AU | 1 | Bridge board | Fab Lab Inventory // South Korea | 2.87 $ | 2.87 $ |
| ATtiny45 microcontroller | ATtiny45 | 2 | Temperature Sensor, Light sensor (+FabTinyISP) | Fab Lab Inventory // | 1.23 $ | 2.46 $ |
| Capacitor | 1 nF 250V X7R 1206- | 1 | Temperature sensor board | Fab Lab Inventory // Mexico | 0.05 $ | 0.05 $ |
| Capacitor | 100 nF 250V X7R 1206- | 1 | ATmega328 | Fab Lab Inventory // Mexico | 0.12 $ | 0.12 $ |
| Capacitor | 1 uF 50V X7R 10% 1206- | 4 | ATmega328, Sensor boards | Fab Lab Inventory // Japan | 0.07 $ | 0.28 $ |
| Resonator | 16 MHz | 1 | ATmega328P | Fab Lab Inventory | 0.45 $ | 0.45 $ |
| Resistor | 499 Ω 1-4W 1% 1206 SMD- | 3 | Green LEDs on each board | Fab Lab Inventory // China | 0.01 $ | 0.03 $ |
| Resistor | 1 kΩ 1-4W 1% 1206 SMD- | 3 | Red LEDs on each board | Fab Lab Inventory // China | 0.01 $ | 0.03 $ |
| Resistor | 2 kΩ | 1 | ATmega328 | Fab Lab Inventory // | 0.01 $ | 0.02 $ |
| Resistor | 10 kΩ 1-4W 1% 1206 SMD | 6 | ATmega328, Sensor boards | Fab Lab Inventory // China | 0.01 $ | 0.06 $ |
| Resistor | 0 kΩ 1-4W 5% 1206 SMD- | 5 | ATmega328 | Fab Lab Inventory // China | 0.00 $ | 0.00 $ |
| Inductor | 10 uH | 2 | ATmega328, Temperature sensor board | Fab Lab Inventory | 0.23 $ | 0.46 $ |
| LED | Red Clear 1206 SMD | 3 | Indicating that the board is powered | Fab Lab Inventory // Taiwan | 0.13 $ | 0.39 $ |
| LED | Green Clear 1206 SMD | 3 | Indicating that microcontroller is receiving a program | Fab Lab Inventory // Taiwan | 0.15 $ | 0.45 $ |
| NTC Thermistor | 10 kΩ 10% 1206- | 2 | Temperature sensor board | Fab Lab Inventory // Japan | 2.50 $ | 5.00 $ |
| Photodarlington NPN | Clear PLCC-2 | 1 | Light sensor board | Fab Lab Inventory // Taiwan | 0.15 $ | 0.15 $ |
| FTDI header 1x6 | 1 | Powering Bridge board (programming phase) | Fab Lab Inventory | 0.60 $ | 0.60 $ | |
| Pin header 2x3 | 4 | NeoPixel strip, Programmer | Fab Lab Inventory | 0.60 $ | 2.40 $ | |
| Pin header 2x2 | 6 | Bridge, Temperature Sensor x2, Light Sensor | Fab Lab Inventory | 0.66 $ | 3.96 $ | |
| Micro-USB | Connector for external power supply | 1 | Powering ATmega328P board, boards on the network, NeoPixels | Fab Lab Inventory | 0.32 $ | 0.32 $ |
| ALL TOGETHER | 23,50 $ | ALL MATERIALS AND COMPONENTS TOGETHER | 103,71 $ |
Possible Ideas for Future Development
The dissemination plan and future opportunities are presented on the Week 20 - Invention, Intellectual Property, and Income documentation. Here, as an inspiration, I will present a few possible ideas for future development of the project.
This could be fun project to make in the classrooms, for presenting an unnoticeable but detrimental noice level for hearing on the classrooms. The screen can be made as a gift and used also in the kindergardens, when the graph is replaced with some easy to understand figure, such as smileys.
| THE PRODUCT | DESCRIPTION | WHAT TO CHANGE TO MAKE IT |
|---|---|---|
| Noice Level on the Room | To make and use e.g in classrooms, kindergarden etc | Voice sensor |
| Forecast Temperature Screen | To learn to apply and present web data through Wi-fi | Utilizing some web data |
| Safe vs. Risk Situations | To learn to create a mobile device application and control the screen over that | Automated update for safe, user updates the risk situations to application |
| Spent Water | To consider and participate in 17 Sustainable Development Goals | |
| Pollutant in the air | Utilizing some web data | |
| Pollen in the air | Utilizing some web data |
Acknowledgement
Finally, I would like to mention how grateful I am to get this fantastic opportunity to participate in Fab Academy 2018. It has been a wonderful learning journey together with the great peers in Fab Lab Oulu. I think we have had an awesome community making through the most central idea of this all: ideating together, commenting, argumenting, sharing knowledge, competences, and ideas, helping and supporting each other to keep up and reach the goals.
Thanks also to the instructor, Lorenzo Negri, and the peers in FabLab Spinderihallerne in Vejle, Denmark, where I was able to start my Fab Academy path on January.
Further, I would like to say many thanks to the great instructor group at Fab Lab Oulu: our Fab Lab Leader Jani Ylioja, Fab Lab Manager Antti Mäntyniemi, and the rest of the helpful and supportive local instructors and staff for their guiding: Iván Sánchez Milara, Jari Pakarinen, Eino Antikainen, Juha-Pekka Mäkelä, Yrjö Louhisalmi, and Tapio Korpela.
For sure, the big thanks with love go to my beloved family and friends on their understanding and support in everything during these five months.
Lastly, great thanks to Neil Gershenfeld and the organisers of Fab Academy for this great diploma and the spring period full of learning and inspiration for the future.
Here are the files of my Final Project:
The Design of the Aluminium Frame:
The Designs of the Screen Structure:
- The white bottom structure of the screen in svg format
- The white bottom structure of the screen in pdf format
- The transparent middle structure of the screen in svg format
- The transparent middle structure of the screen in pdf format
- The three-colored scale in svg format
- The three-colored scale in pdf format
The Designs of the User Information Sticker:
The 3D Designs of the Cable Holders:
- The Cable Holder no:1 made with Autodesk Inventor in ipt format
- The Cable Holder no:1 made with Autodesk Inventor in stl format
- The Cable Holder no:1 made with Autodesk Inventor in obj format
- The Cable Holders no:2-4 made with Autodesk Inventor in ipt format
- The Cable Holders no:2-4 made with Autodesk Inventor in stl format
- The Cable Holders no:2-4 made with Autodesk Inventor in obj format
The Designs of the Silicone Rubber Cover for the Outside Temperature Sensor:
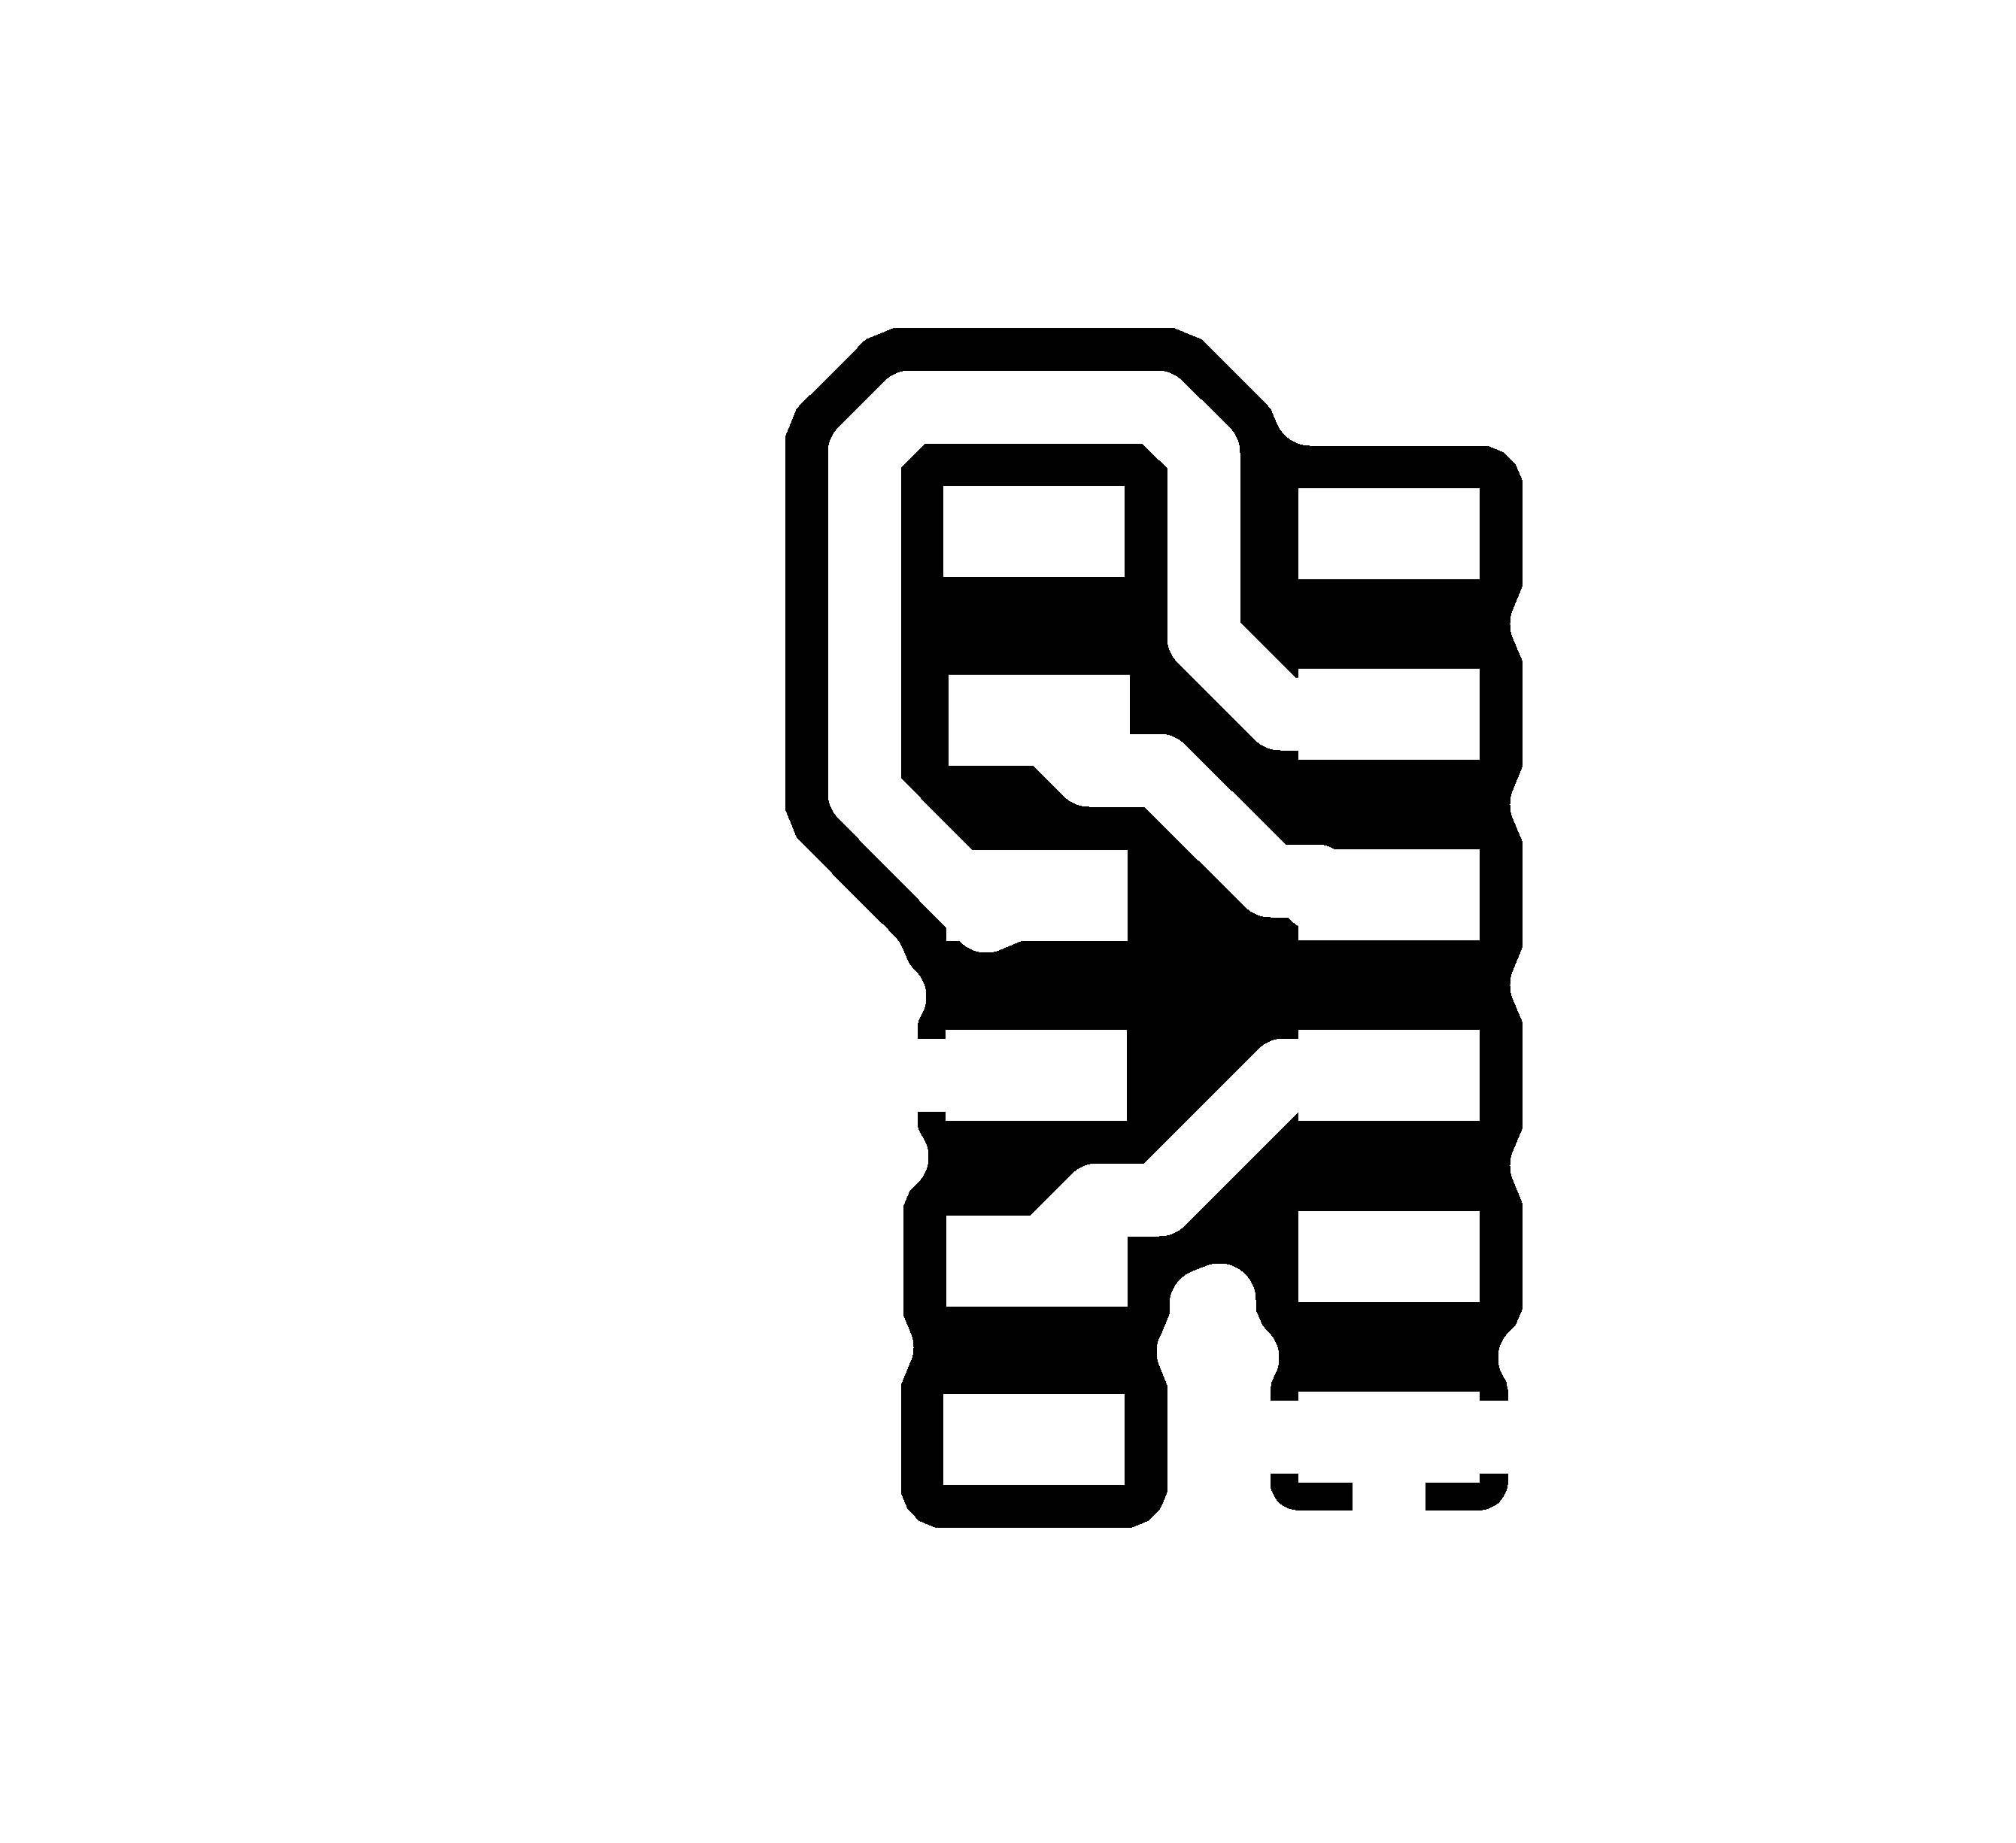
The Design of the Microcontroller Boards:
- Schematic in sch format
- Board Layout in brd format
- The Traces (changed from png to jpg format when reduced the size)
- The Outline (changed from png to jpg format when reduced the size)
ATmega328 Bridge, ATtiny45 temperature sensor network board and ATtiny45 light sensor board:
The Design of the Outside Temperature Board (two-pieces):
The Designs of the NeoPixel connector boards:
- The Schematic of the first set (8 pieces) in sch format
- The Boards Layout of the first set (8 pieces) in brd format
- The Traces of the first set (8 pieces) in png format
- The Outline of the first set (8 pieces) in png format
- The Schematic of the second set (6 pieces) in sch format
- The Schematic of the second set (6 pieces) in brd format
- The Traces of the second set (6 pieces) in png format
- The Outline of the second set (6 pieces) in png format
The Design of the Bluetooth module connector:
The software for temperature and light sensor inputs to lit up NeoPixel output:
- The presentation software of the ATmega328 bridge board in ino format
- The presentation software of the ATtiny45 light sensor node board in ino format