
Kati Pitkänen @ FAB LAB OULU · 2018
© 2018 Kati Pitkänen · Template by Bootstrapious

This work is licensed under a Creative Commons Attribution-NonCommercial-ShareAlike 4.0 International License.
Interface and Application Programming
Week 14 · [ 18.4.2018 - ]
- Write an application that interfaces with an input and/or output device that you made. (Individual Project)
- Compare as many tool options as possible. (Group Project)
This week I made a simple graphics UI with Processing for showing the current temperature, as well as short temperature history measured with my temperature sensor board. I have used Processing earlier for some music coding but it was different at that time, when I was only creating something new. This time, I had an input, the temperature value measured with my temperature sensor board and sent with ATmega328P board. I had to receive the value, convert and calculate it in usable mode and then show the value in UI.
I had very limited time to finish next two week's assignment. I had prepared myself for that by making the boards for these assignments already during the previous two weeks. However, in the beginning, when trying to get everything done quickly it was harder than I had thought. Thanks for the help and explaining the basics to our this week's local instructor Iván Sánchez Milara. In addition, the documentation done by our previous year Fab Academy student Jari Pakarinen helped me to increase my understanding about the topic. For sure in the end, after some struggling and learning to see how the code has to be structured and what commands to use, it was easier to get what was going on the code and start playing with some small details.
Working with Arduino IDE
First, I wanted to declare Arduino language for me a little bit more. The arduino environment utilized their own C++ libraries containing built-in assumptions to simplify the coding process. I learned about the different data types that are commonly seen in Arduino, defined in the beginning of the programming command.
Here are some of those variables, including the memory size of the data, found from Sparkfun. Here, signed variables allow both positive and negative numbers, while unsigned variables allow only positive values.
- boolean (1 byte// 8 bit) - simple logical true/false
- byte (1 byte// 8 bit) - unsigned number from 0-255
- char (1 byte// 8 bit) - signed number from -128 to 127
- unsigned char (1 byte// 8 bit) - same as ‘byte’; if this is what you’re after, for reasons of clarity, use ‘byte’ instead
- word (2 bytes// 16 bit) - unsigned number from 0-65535
- int (2 bytes// 16 bit) - signed number from -32768 to 32767. One of the most common variable in Arduino IDE.
- unsigned int (2 bytes// 16 bit)- the same as ‘word’ ; for clarity and brevity, use ‘word’ instead
- float (4 bytes// 32 bit) - signed number from -3.4028235E38 to 3.4028235E38.
- long (4 bytes// 32 bit) - signed number from -2,147,483,648 to 2,147,483,647
- unsigned long (4 bytes// 32 bit) - unsigned number from 0-4,294,967,295.
- The most common usage of this is to store the result of the millis() function, which returns the number of milliseconds the current code has been running
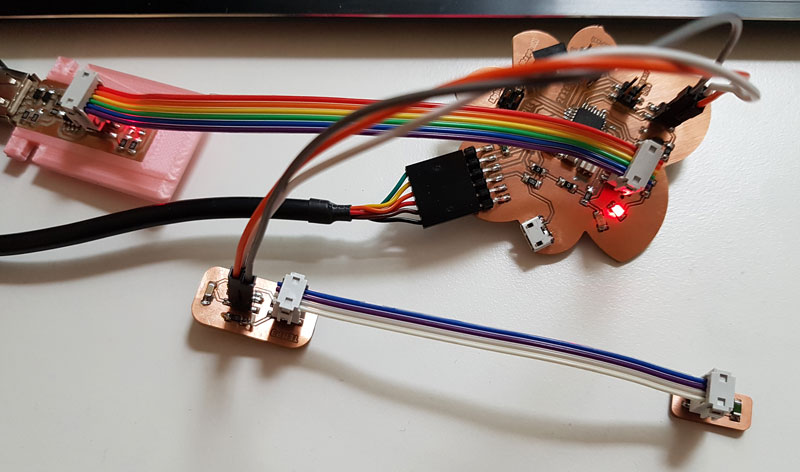
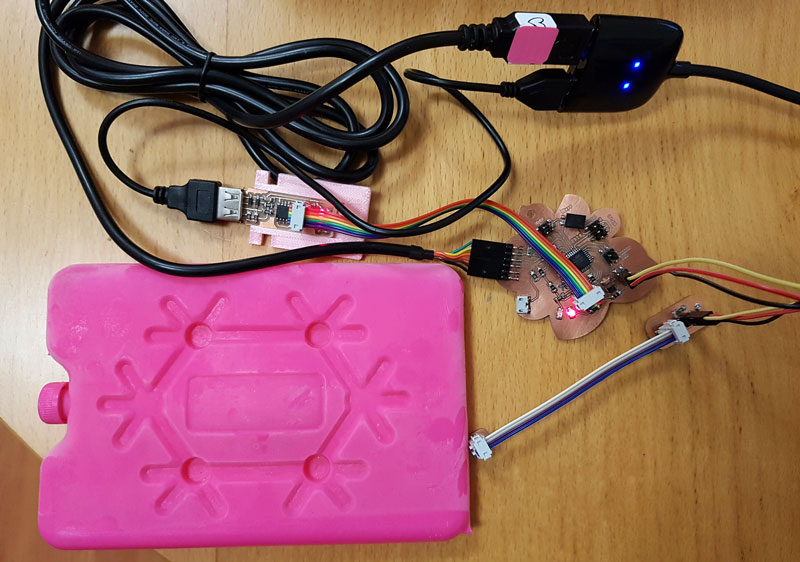
Then, I made a setup of my input device: temperature sensing device.
- FTDI -cable connected to ATmega328 -board // for powering the board (the red LED is indicating that the board is powered)
- Temperature sensor board connected to ATmega328 -board // for getting the varying analog value that NTC thermistor has based on the temperature
- ATmega328 -board connected to USBtinyISP -programmer // for programming the code that reads temperature value from the sensor board
Here is the pin configuration presenting the pin header connecting the temperture sensor board to ATmega328 board:
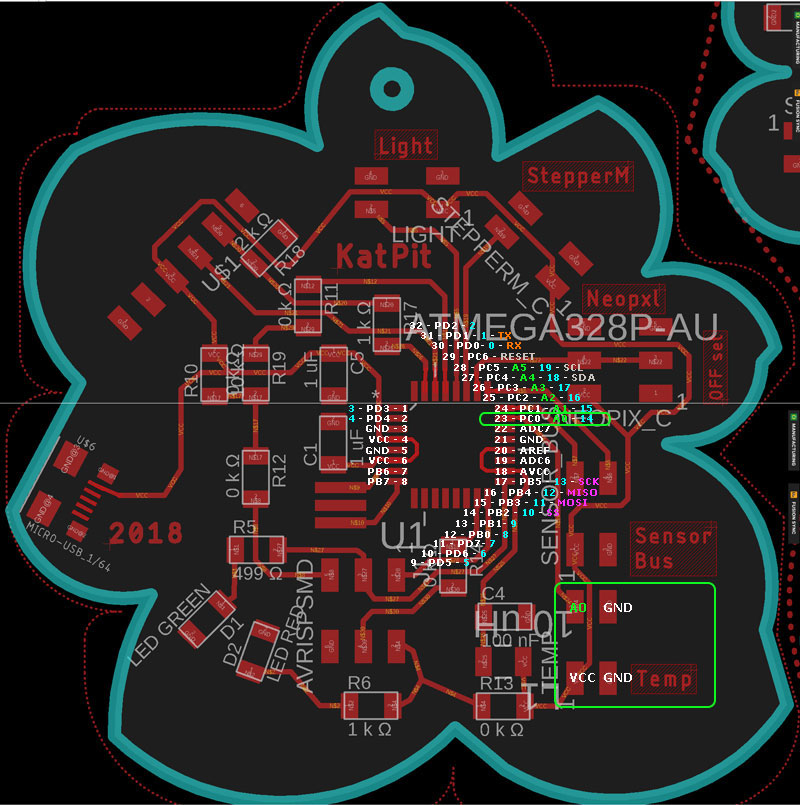
In this case, the role of the ATmega328P -board is to read the analog value from the NTC thermistor sensor -board and send it to the serial port as a binary value (bytes)
using Serial.write.
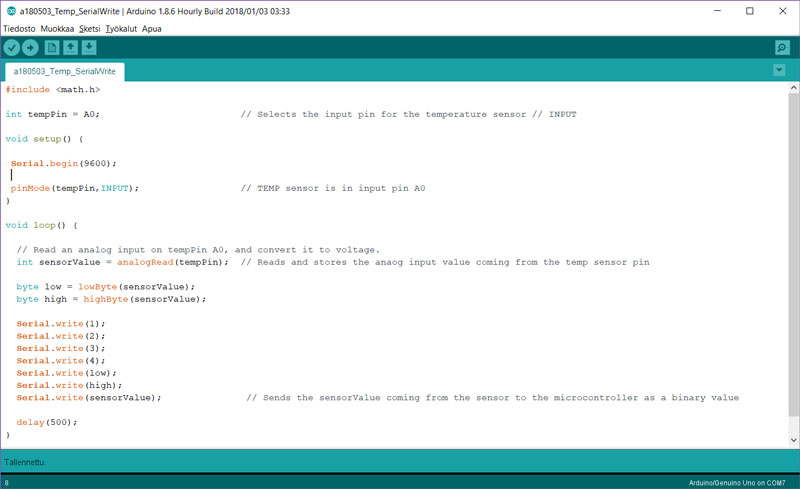
Serial.write(1)-Serial.write(4) is for sending a preamble consisting of 4 bytes (1,2,3,4). Preamble is a constant for identifying a new data, being a byte that has recognizable start and stop bits. New sensor values will be checked every time when the new loop starts. Then, the preamble is sent first through serial communication, and after that is sent the actual sensor value from the sensor, in my case meaning the low byte of the sensorValue and the hight byte of the sensorValue. So, when the receiver starts to listen the data it waits for the preamble and after recognizing it, the receiver knows which is the right phase to start listening the sensor value data.
At this phase, I learned the difference between Serial.print(), which I used earlier to write data to serial monitor, and Serial.write(), which I will use now for writing to serial port. Serial.print() is for sending the characters representing the digits of a number. This means, that each digit of the integer will be sent in the form of ASCII code, and the cmmand will print the data to the serial port as human-readable ASCII text.
Serial.print("Default temperature is:");// Prints to the Serial Monitor Default temperature is:Serial.println("< 25 Celsius degrees");// Prints to the Serial Monitor < 25 Celsius degrees
As for Serial.write(), it is sent as a byte or series of bytes, so it writes binary data to the serial port.
Serial.write(sensorValue);// Writes to the Serial Port the value of a sensor as a binary valueSerial.write(23);// Writes to the Serial Port a byte with the value 23
This is the Arduino code for sending the sensor value data to the serial port:
Working with Processing
For creating the UI (user interface) to show the current temperature, as well as a small temperature history, I used free and open source Processing. Processing is a flexible software sketchbook and a language for learning how to code within the context of the visual arts.
In this project, the idea is, that Processing reads the temperature data, that ATmega328 board sends as high and low ADC bytes through serial port. When Processing receives input data, it calculates and converts ACD value to real temperature value in Celsius degrees, and displays it in the temperature history graphics UI.
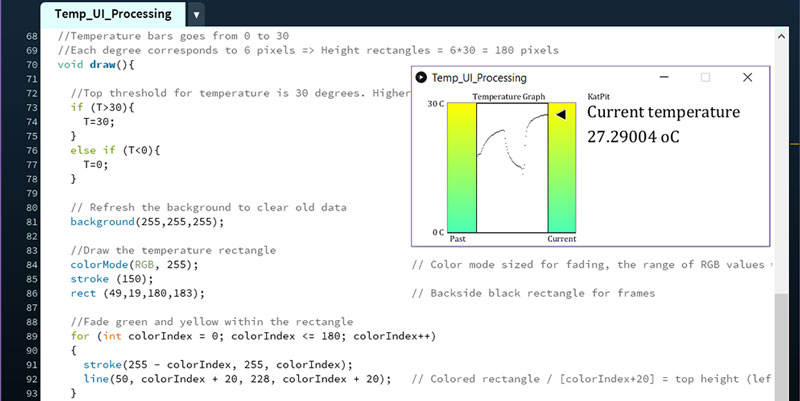
I had some challenges with scaling and frameRate. I wanted to modify the existing code, where the temperature scale was originally from 0 Celsius degrees to 100 Celsius degrees, to have a scale more near to room temperature from 0 Celsius degrees to 30 Celsius degrees. I managed to change the visual UI easily but the scaling of it was wrong. For drawing the graphics correct, the solution was to make some calculation and divide the scale height so that each degree corresponds to some certain amount of pixels. In this case, frame height was set to 180 pixels to provide 6 pixels per degree [30 in total, degrees from 0 to 30].
Another challenge was, that the frameRate in the original code was 100 frames per second, so it was changing all the time and the graphics line presented actually only a very short period of history temperatures. Solution for this was to take and present only the last frame value received from ATmega328P through Serial Port. Finally, I managed to get my ideas working thanks to the help of Iván.
My code for showing the temperature in UI Graphics made with Processing is obtained and modified from here. What is changed is the size of the graphics, visualisation, scaling, frameRate, and text information. These changes are explained detailed in the following paragraphs.
is a class for sending and receiving data using the serial communication protocol.
First, I am importing Serial communication library import processing.serial.*;
and defining the variables that I will use in the code.
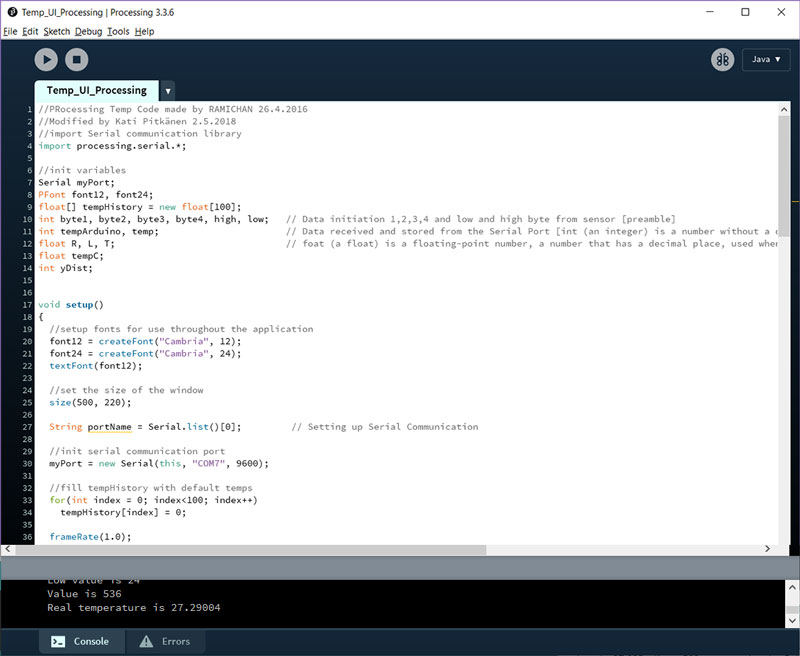
Then, I am doing setup() function, that runs once, when the program starts. In this function I will define initial enviroment properties such as screen size, and load media such as font, as the program starts.
Further, Serial Communication is set up to print all the data from the input source
String portName = Serial.list()[0];
and the Serial Port [myPort] is created myPort = new Serial(this, "COM7", 9600);.
"A Table" storing 100 temperature values history, is set up for(int index = 0; index<100; index++) /
tempHistory[index] = 0;.
It is recommended to set the frame rate within setup(), as frameRate(fps), where parameter fps floats the number of desired frames per second. Thus, frameRate() specifies the number of frames to be displayed every second meaning, that frameRate(1.0) will refresh the frame once per second. (The default rate is 60 frames per second.)
is called when data is available:
void serialEvent(Serial p) {.
First, there is a preamble from the Serial Port. When Processing starts to listen the input data, it recognizes preamble and knows that after that will begin the actual data.
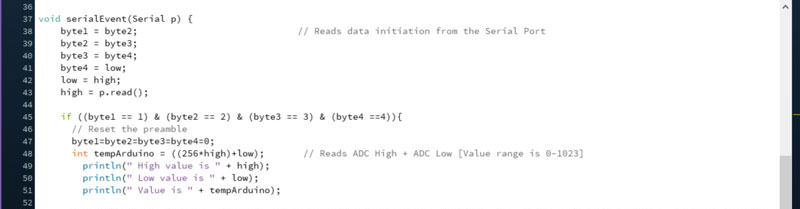
The command int tempArduino = ((256*high)+low); reads ADC High + ADC Low (Analog Digital Converter), which
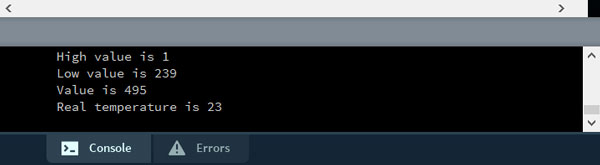
value range is 0-1023. The println() function writes information to the console area, which is the
black rectangle at the bottom of the Processing environment, being helpful for looking at the data the program is producing. In this case, console is displaying four values:
ADC High value, ADC Low value, combined 10-bit value, and Real temperature value.
At this phase it was print as int: println(" Real temperature is " + temp);/
temp = int(T);. However, I wanted to see decimals so later on, I changed to show
float T value.
- Each call to this function creates a new line of output.
- Individual elements can be separated with quotes ("") and joined with the addition operator (+).
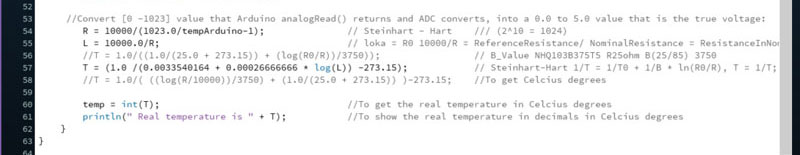
Following is the temperature calculation I have obtained originally from my fellow student Ari, and modified it slightly to fit my program and explained it to myself next to the code lines.
The draw() function continuously executes the lines of code contained inside its block until the program is stopped. The number of times draw() executes in each second may be controlled with the frameRate() function, that was set in the setup().
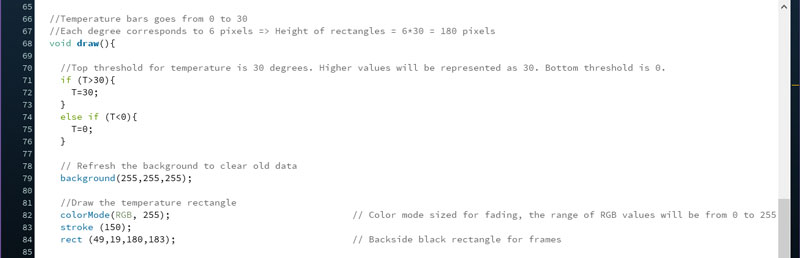
By default, the parameters for background(), color(), stroke(), anf fill() are defined by values between 0 and 255 using the RGB color model.
The background() function sets the color used for the background of the Processing window, and in this case to clear the contents of the window at the beginning of each frame. It can be used also inside setup() to set the background in case the backgound need only be set once.
The colorMode() -function changes the numerical range used for specifying colors and to switch color systems.
colorMode(RGB, 255); sets colorMode to RGB corresponding to Red/Green/Blue (another option is HSB
corresponding to Hue/Saturation/Brightness).
The stroke() -function sets the color used to draw lines and borders around shapes. The default color space is RGB, with each value in the range from 0 to 255, but it has to be specified in terms of the RGB or HSB color depending on the current colorMode(). Also, the value for the grayscale parameter must be less than or equal to the current maximum value as specified by colorMode(), in this case stroke(gray), 150, is middle gray.
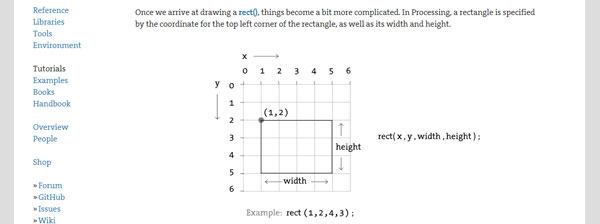
The rectangles are drawn using rect() -function [rect(49, 19, 180, 183)]:
- The first two values are defining the place of the left top corner (X, Y)
- The third value is the width of the rectangle
- The fourth value is the height of the rectangle
- The fifth value is radius, which can be added for rounding all the corners of the rectangle
Using fill() -function
- In the digital world, colors are defined as a range of numbers, e.g. in grayscale where 0 means black and 255 means white.
- Adding only one value // fill(255) means filling the area with white color
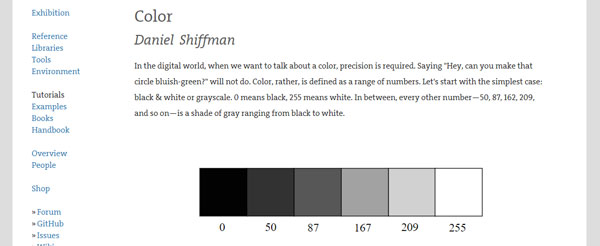
- Digital colors are also constructed by mixing three primary colors: red, green and blue.
- Adding three values // fill(0,0,0) means mixing the three RGB colors constructing the final color together

Here, the graph setting of UI is defined: fade colored rectangle, the line updated based on temperature, and the pointer presenting current temperature.
The frame height 180 pixels provides 6 pixels per degree [30 in total, degrees from 0 to 30]:
point(90 + index, 180+20 - tempHistory[index]*6).
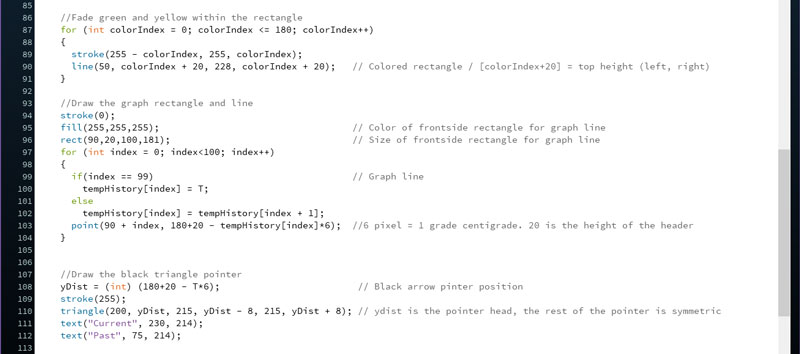
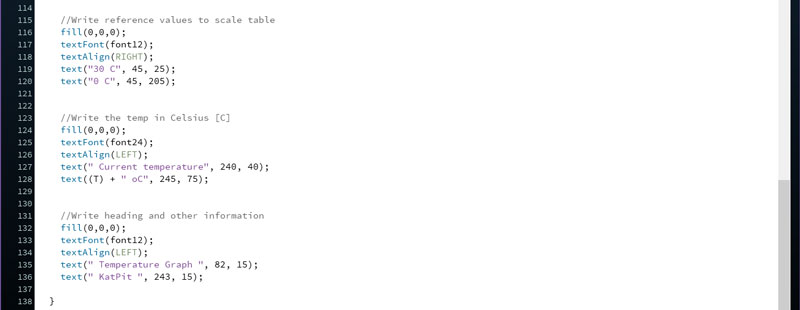
The last piece of code contains all the text information on the UI:
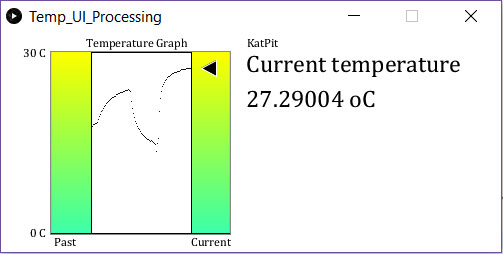
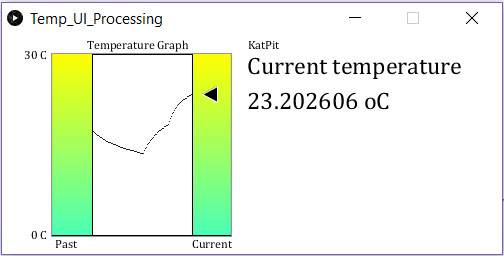
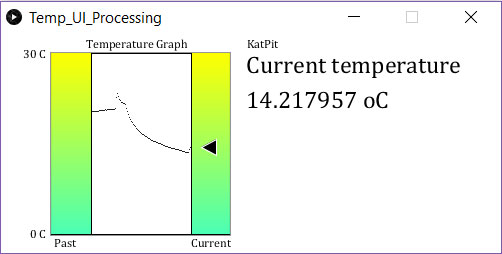
Testing and playing with the temperature graphics
Here are the programming codes for my Temperature Graphics I programmed this week.