Week 12 assignments:
Interface and Application Programming:
From Fab Academy 2018 assignments
1. Write an application that interfaces with an input and/or output device that you made,comparing as many tool options as possible..
Have:
Described your design and fabrication process using words/images/screenshots.
Explained the the GUI that you made and how you did it.
Outlined problems and how you fixed them.
Included original code.
1. Write an application that interfaces with an input and/or output device that you made, comparing as many tool options as possible.
For this assignment I decided to make an interface that allows to visualize the values obtained by the sensors. For this use the processing software.
PROCESSING

Processing is an easy-to-use, open source, Java-based integrated programming language and programming environment that serves as a medium for the teaching and production of multimedia and interactive digital design projects.
Described your process using words/images/screenshots
For this practice I use the Processing program, I describe the installation process, programming of the interface and communication with the input and output device.
Installation
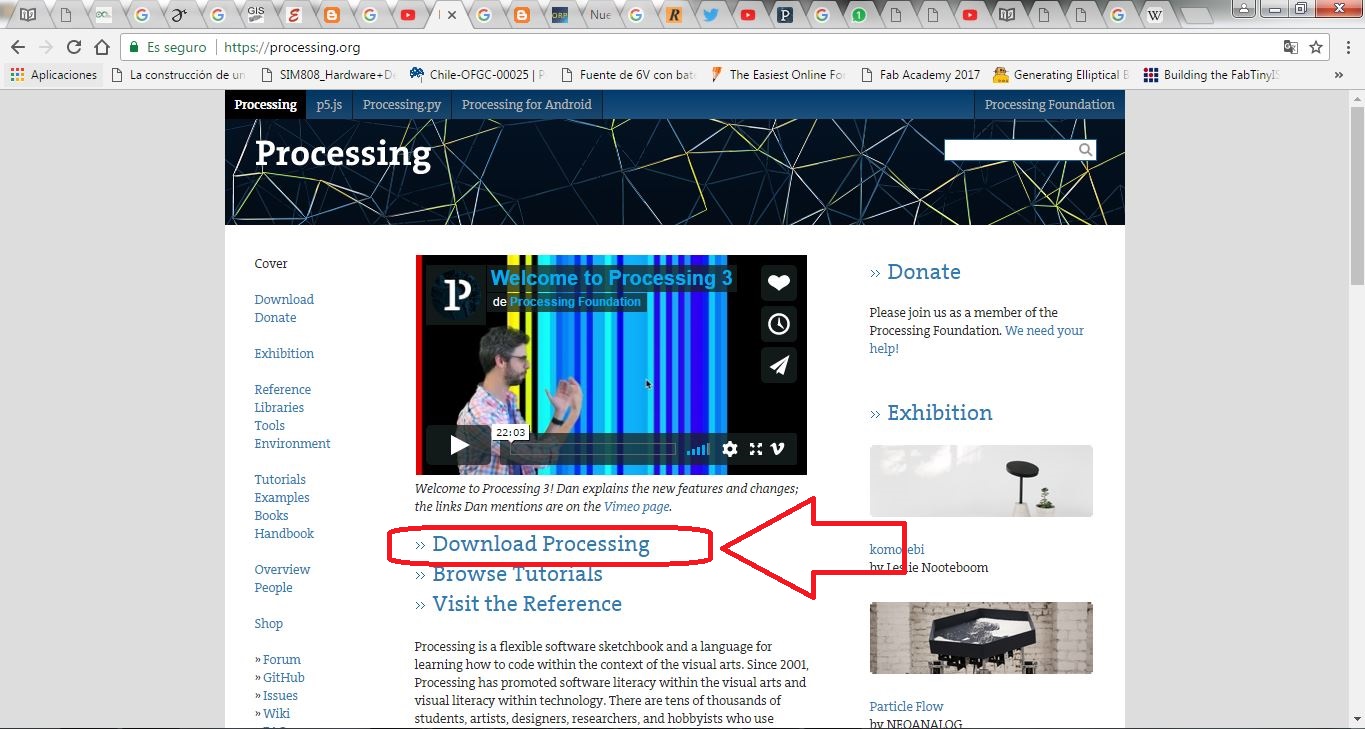
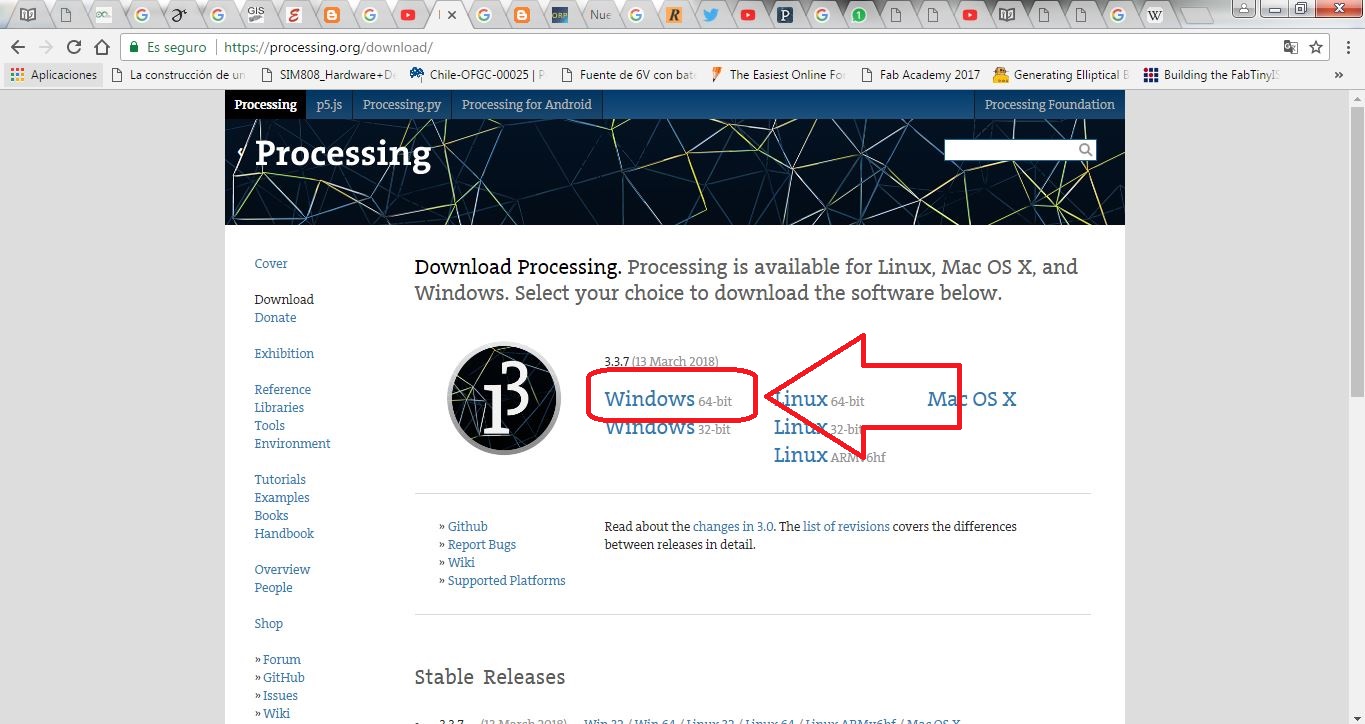
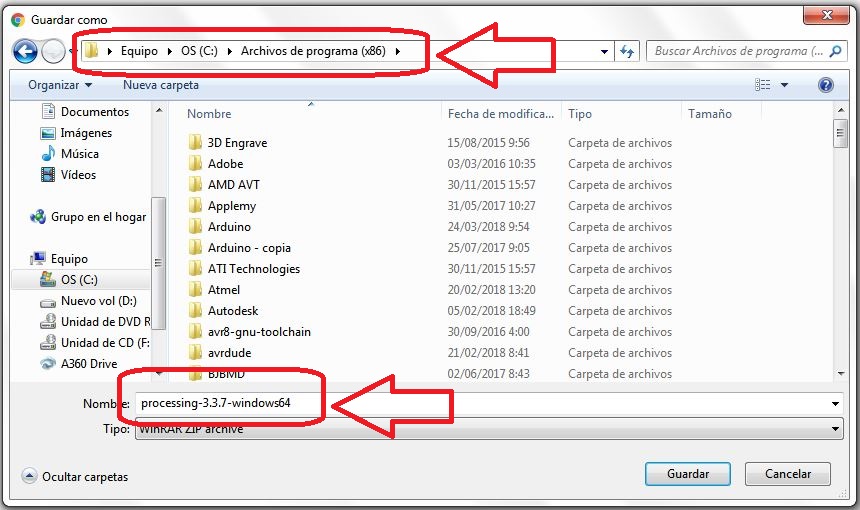
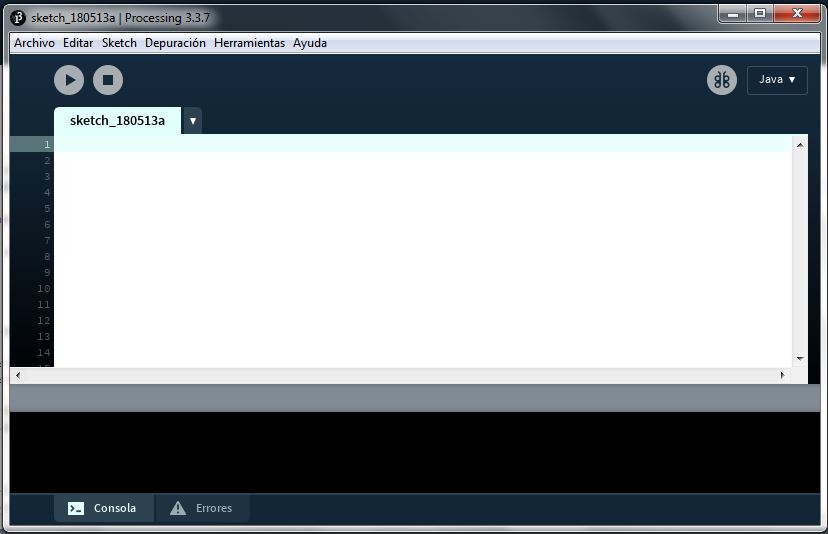
For the installation you just have to go to the page of Processing and download the integrated development environment
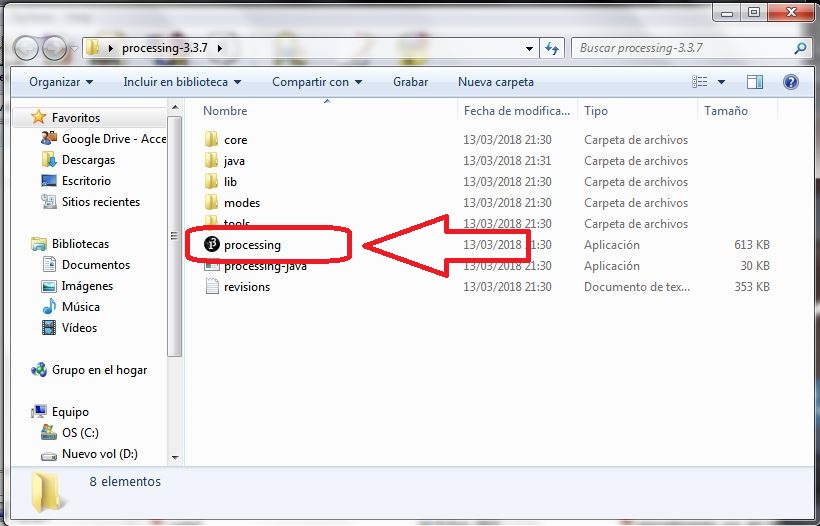
It is only necessary to unzip the file and we will have ready the development environment of processing to program our application and open the software.
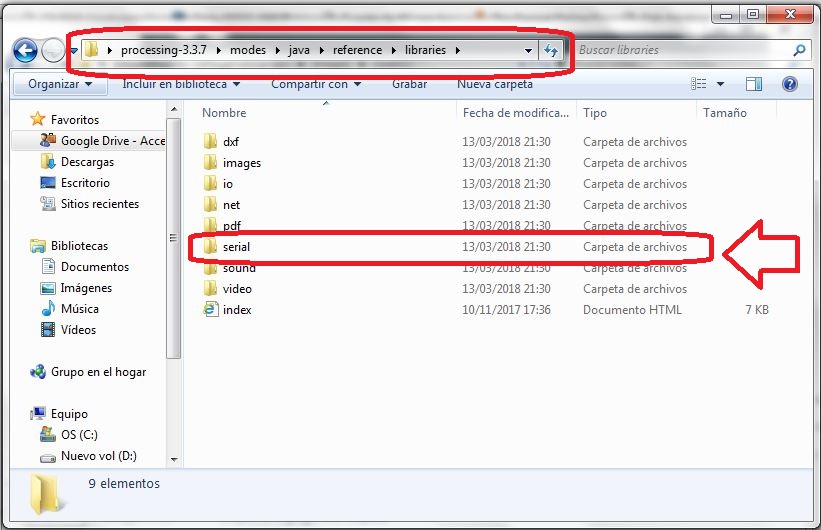
After installing the integrated processing development environment it is also important to download and install a serial communication library that allows us to send and receive data through the serial port to communicate with the microcontrollers, this library is usually by default however you can download it in the following link.
Interface Programming
1.- Import Serial communication library

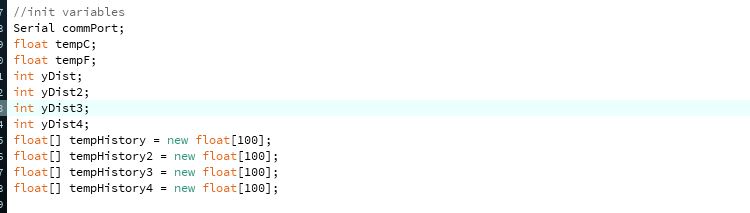
2.- Init variables
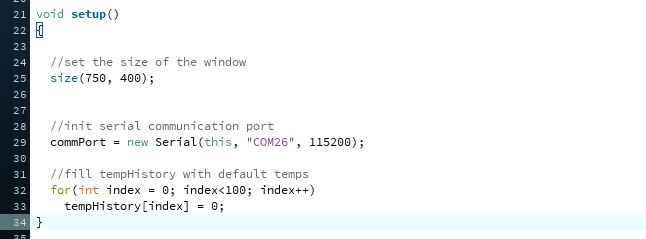
3. Setup parameters
4. Void Draw () Programming
void draw()
{
  //get the temp from the serial port
  while (commPort.available() > 0)
  {
    tempC = commPort.read();
    //refresh the background to clear old data
    background(255,255,255);
    //draw the temp rectangle
    colorMode(RGB, 160);  //use color mode sized for fading
    stroke (0);
    rect (49,19,22,162);
    //fade red and blue within the rectangle
    for (int colorIndex = 0; colorIndex <= 160; colorIndex++)
    {
      stroke(160 - colorIndex, 0, colorIndex);
      line(50, colorIndex + 20, 70, colorIndex + 20);
    }
    //draw graph
    stroke(1);
    fill(43,255,0);
    rect(90,10,100,180);
    for (int index = 0; index<100; index++)
    {
      if(index == 99)
        tempHistory[index] = tempC;
      else
        tempHistory[index] = tempHistory[index + 1];
      point(90 + index, 180 - tempHistory[index]);
    }

    //write reference values
    fill(0,0,0);

    textAlign(RIGHT);
    text("HIGH", 45, 25);
    text("LOW", 45, 187);

    //draw triangle pointer
    yDist = int(160-tempC);
    stroke(0);
    triangle(75, yDist + 20, 85, yDist + 15, 85, yDist + 25);


    //draw the temp rectangle
    colorMode(RGB, 160);  //use color mode sized for fading
    stroke (0);
    rect (230,19,22,162);
    //fade red and blue within the rectangle
    for (int colorIndex2 = 0; colorIndex2 <= 160; colorIndex2++)
    {
      stroke(160 - colorIndex2, 0, colorIndex2);
      line(231, colorIndex2 + 20, 251, colorIndex2 + 20);
    }

//draw triangle pointer
    yDist2 = int(160- tempC);
    stroke(0);
    triangle(256, yDist2 + 20, 266, yDist2 + 15, 266, yDist2 + 25);

  //draw triangle pointer
    yDist3 = int(160- tempC);
    stroke(0);
    triangle(438, yDist3 + 20, 448, yDist3 + 15, 448, yDist3 + 25);

//draw triangle pointer
    yDist4 = int(160- tempC);
    stroke(0);
    triangle(438+182, yDist4 + 20, 448+182, yDist4 + 15, 448+182, yDist4 + 25);


     //draw graph
    stroke(1);
   fill(43,255,0);
    rect(271,10,100,180);
    for (int index = 0; index<100; index++)
    {
      if(index == 99)
        tempHistory2[index] = tempC;
      else
        tempHistory2[index] = tempHistory[index + 1];
      point(271 + index, 180 - tempHistory[index]);
    }

         //draw graph
    stroke(1);
   fill(43,255,0);
    rect(412+41+182,10,100,180);
    for (int index = 0; index<100; index++)
    {
      if(index == 99)
        tempHistory2[index] = tempC;
      else
        tempHistory2[index] = tempHistory[index + 1];
      point(412+41+182 + index, 180 - tempHistory[index]);
    }

     //draw graph
    stroke(1);
   fill(43,255,0);
    rect(412+41,10,100,180);
    for (int index = 0; index<100; index++)
    {
      if(index == 99)
        tempHistory2[index] = tempC;
      else
        tempHistory2[index] = tempHistory[index + 1];
      point(412+41 + index, 180 - tempHistory[index]);
    }


    //draw the temp rectangle
    colorMode(RGB, 160);  //use color mode sized for fading
    stroke (0);
    rect (412,19,22,162);
    //fade red and blue within the rectangle
    for (int colorIndex = 0; colorIndex <= 160; colorIndex++)
    {
      stroke(160 - colorIndex, 0, colorIndex);
      line(413, colorIndex + 20,413+20, colorIndex + 20);
    }


        //draw the temp rectangle
    colorMode(RGB, 160);  //use color mode sized for fading
    stroke (0);
    rect (413+181,19,22,162);
    //fade red and blue within the rectangle
    for (int colorIndex = 0; colorIndex <= 160; colorIndex++)
    {
      stroke(160 - colorIndex, 0, colorIndex);
      line(414+181, colorIndex + 20,414+181+20, colorIndex + 20);
    }


  }
}
Results
Explained the the GUI that you made and how you did it
void draw()
{
//get the temp from the serial port
while (commPort.available() > 0)
{
tempC = commPort.read();
//refresh the background to clear old data
background(255,255,255);
//draw the temp rectangle
colorMode(RGB, 160); //use color mode sized for fading
stroke (0);
rect (49,19,22,162);
//fade red and blue within the rectangle
for (int colorIndex = 0; colorIndex <= 160; colorIndex++)
{
stroke(160 - colorIndex, 0, colorIndex);
line(50, colorIndex + 20, 70, colorIndex + 20);
}
//draw graph
stroke(1);
fill(43,255,0);
rect(90,10,100,180);
for (int index = 0; index<100; index++)
{
if(index == 99)
tempHistory[index] = tempC;
else
tempHistory[index] = tempHistory[index + 1];
point(90 + index, 180 - tempHistory[index]);
}
//write reference values
fill(0,0,0);
textAlign(RIGHT);
text("HIGH", 45, 25);
text("LOW", 45, 187);
//draw triangle pointer
yDist = int(160-tempC);
stroke(0);
triangle(75, yDist + 20, 85, yDist + 15, 85, yDist + 25);
//draw the temp rectangle
colorMode(RGB, 160); //use color mode sized for fading
stroke (0);
rect (230,19,22,162);
//fade red and blue within the rectangle
for (int colorIndex2 = 0; colorIndex2 <= 160; colorIndex2++)
{
stroke(160 - colorIndex2, 0, colorIndex2);
line(231, colorIndex2 + 20, 251, colorIndex2 + 20);
}
//draw triangle pointer
yDist2 = int(160- tempC);
stroke(0);
triangle(256, yDist2 + 20, 266, yDist2 + 15, 266, yDist2 + 25);
//draw triangle pointer
yDist3 = int(160- tempC);
stroke(0);
triangle(438, yDist3 + 20, 448, yDist3 + 15, 448, yDist3 + 25);
//draw triangle pointer
yDist4 = int(160- tempC);
stroke(0);
triangle(438+182, yDist4 + 20, 448+182, yDist4 + 15, 448+182, yDist4 + 25);
//draw graph
stroke(1);
fill(43,255,0);
rect(271,10,100,180);
for (int index = 0; index<100; index++)
{
if(index == 99)
tempHistory2[index] = tempC;
else
tempHistory2[index] = tempHistory[index + 1];
point(271 + index, 180 - tempHistory[index]);
}
//draw graph
stroke(1);
fill(43,255,0);
rect(412+41+182,10,100,180);
for (int index = 0; index<100; index++)
{
if(index == 99)
tempHistory2[index] = tempC;
else
tempHistory2[index] = tempHistory[index + 1];
point(412+41+182 + index, 180 - tempHistory[index]);
}
//draw graph
stroke(1);
fill(43,255,0);
rect(412+41,10,100,180);
for (int index = 0; index<100; index++)
{
if(index == 99)
tempHistory2[index] = tempC;
else
tempHistory2[index] = tempHistory[index + 1];
point(412+41 + index, 180 - tempHistory[index]);
}
//draw the temp rectangle
colorMode(RGB, 160); //use color mode sized for fading
stroke (0);
rect (412,19,22,162);
//fade red and blue within the rectangle
for (int colorIndex = 0; colorIndex <= 160; colorIndex++)
{
stroke(160 - colorIndex, 0, colorIndex);
line(413, colorIndex + 20,413+20, colorIndex + 20);
}
//draw the temp rectangle
colorMode(RGB, 160); //use color mode sized for fading
stroke (0);
rect (413+181,19,22,162);
//fade red and blue within the rectangle
for (int colorIndex = 0; colorIndex <= 160; colorIndex++)
{
stroke(160 - colorIndex, 0, colorIndex);
line(414+181, colorIndex + 20,414+181+20, colorIndex + 20);
}
}
}
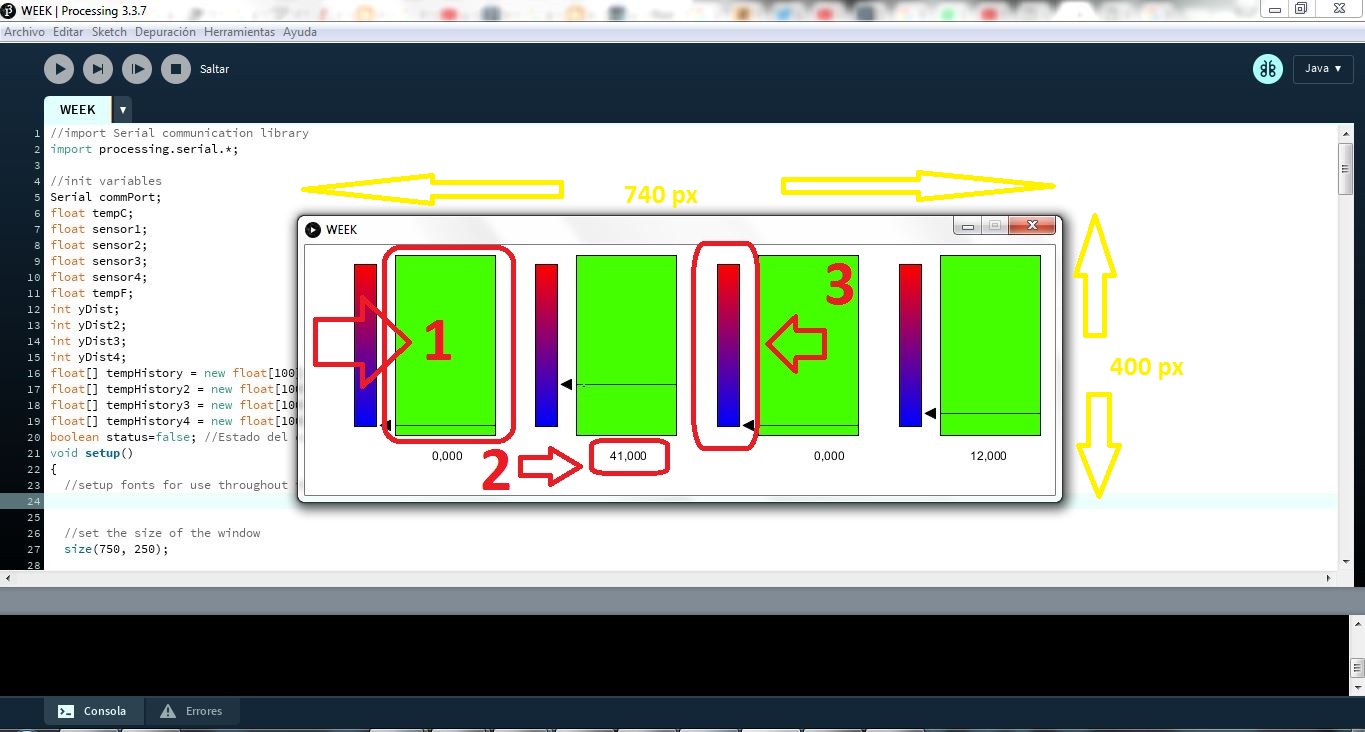
- The size of the interface window is 740 x 400 pixels
- The interface allows to obtain the data of four sensors connected to the electronic circuit
- The interface allows to visualize the variations of the sensors graphically, and also to see the numerical value and in scale of the variations.
- When the value of the sensor exceeds a limit value and placed as output devices LED indicators.
Processing programming
//import Serial communication library
import processing.serial.*;

//init variables
Serial commPort;
float tempC;
float tempF;
int yDist;
int yDist2;
int yDist3;
int yDist4;
float[] tempHistory = new float[100];
float[] tempHistory2 = new float[100];
float[] tempHistory3 = new float[100];
float[] tempHistory4 = new float[100];


void setup()
{

  //set the size of the window
  size(750, 400);


  //init serial communication port
  commPort = new Serial(this, "COM26", 115200);

  //fill tempHistory with default temps
  for(int index = 0; index<100; index++)
    tempHistory[index] = 0;
}

void draw()
{
  //get the temp from the serial port
  while (commPort.available() > 0)
  {
    tempC = commPort.read();
    //refresh the background to clear old data
    background(255,255,255);
    //draw the temp rectangle
    colorMode(RGB, 160);  //use color mode sized for fading
    stroke (0);
    rect (49,19,22,162);
    //fade red and blue within the rectangle
    for (int colorIndex = 0; colorIndex <= 160; colorIndex++)
    {
      stroke(160 - colorIndex, 0, colorIndex);
      line(50, colorIndex + 20, 70, colorIndex + 20);
    }
    //draw graph
    stroke(1);
    fill(43,255,0);
    rect(90,10,100,180);
    for (int index = 0; index<100; index++)
    {
      if(index == 99)
        tempHistory[index] = tempC;
      else
        tempHistory[index] = tempHistory[index + 1];
      point(90 + index, 180 - tempHistory[index]);
    }

    //write reference values
    fill(0,0,0);

    textAlign(RIGHT);
    text("HIGH", 45, 25);
    text("LOW", 45, 187);

    //draw triangle pointer
    yDist = int(160-tempC);
    stroke(0);
    triangle(75, yDist + 20, 85, yDist + 15, 85, yDist + 25);


    //draw the temp rectangle
    colorMode(RGB, 160);  //use color mode sized for fading
    stroke (0);
    rect (230,19,22,162);
    //fade red and blue within the rectangle
    for (int colorIndex2 = 0; colorIndex2 <= 160; colorIndex2++)
    {
      stroke(160 - colorIndex2, 0, colorIndex2);
      line(231, colorIndex2 + 20, 251, colorIndex2 + 20);
    }

//draw triangle pointer
    yDist2 = int(160- tempC);
    stroke(0);
    triangle(256, yDist2 + 20, 266, yDist2 + 15, 266, yDist2 + 25);

  //draw triangle pointer
    yDist3 = int(160- tempC);
    stroke(0);
    triangle(438, yDist3 + 20, 448, yDist3 + 15, 448, yDist3 + 25);

//draw triangle pointer
    yDist4 = int(160- tempC);
    stroke(0);
    triangle(438+182, yDist4 + 20, 448+182, yDist4 + 15, 448+182, yDist4 + 25);


     //draw graph
    stroke(1);
   fill(43,255,0);
    rect(271,10,100,180);
    for (int index = 0; index<100; index++)
    {
      if(index == 99)
        tempHistory2[index] = tempC;
      else
        tempHistory2[index] = tempHistory[index + 1];
      point(271 + index, 180 - tempHistory[index]);
    }

         //draw graph
    stroke(1);
   fill(43,255,0);
    rect(412+41+182,10,100,180);
    for (int index = 0; index<100; index++)
    {
      if(index == 99)
        tempHistory2[index] = tempC;
      else
        tempHistory2[index] = tempHistory[index + 1];
      point(412+41+182 + index, 180 - tempHistory[index]);
    }

     //draw graph
    stroke(1);
   fill(43,255,0);
    rect(412+41,10,100,180);
    for (int index = 0; index<100; index++)
    {
      if(index == 99)
        tempHistory2[index] = tempC;
      else
        tempHistory2[index] = tempHistory[index + 1];
      point(412+41 + index, 180 - tempHistory[index]);
    }


    //draw the temp rectangle
    colorMode(RGB, 160);  //use color mode sized for fading
    stroke (0);
    rect (412,19,22,162);
    //fade red and blue within the rectangle
    for (int colorIndex = 0; colorIndex <= 160; colorIndex++)
    {
      stroke(160 - colorIndex, 0, colorIndex);
      line(413, colorIndex + 20,413+20, colorIndex + 20);
    }


        //draw the temp rectangle
    colorMode(RGB, 160);  //use color mode sized for fading
    stroke (0);
    rect (413+181,19,22,162);
    //fade red and blue within the rectangle
    for (int colorIndex = 0; colorIndex <= 160; colorIndex++)
    {
      stroke(160 - colorIndex, 0, colorIndex);
      line(414+181, colorIndex + 20,414+181+20, colorIndex + 20);
    }


  }
}
Arduino Programming
In this practice I used an own design of my arduino board the same that I share next.
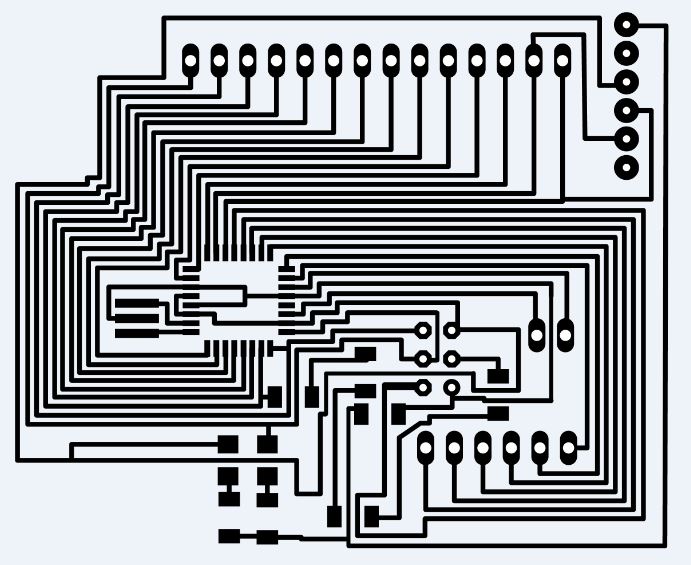

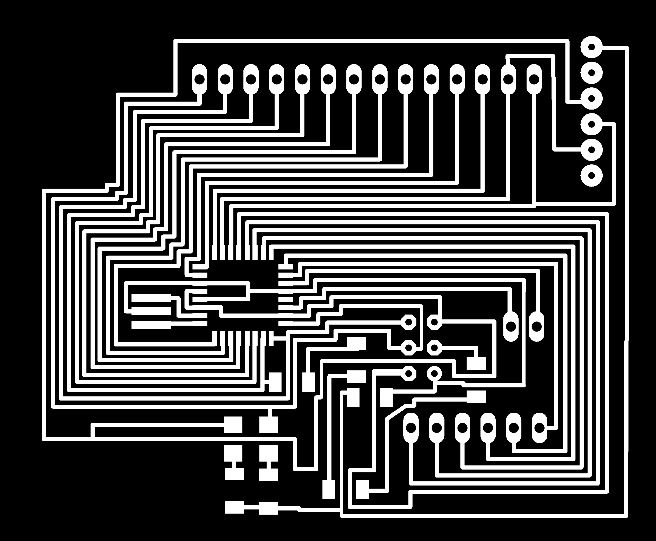
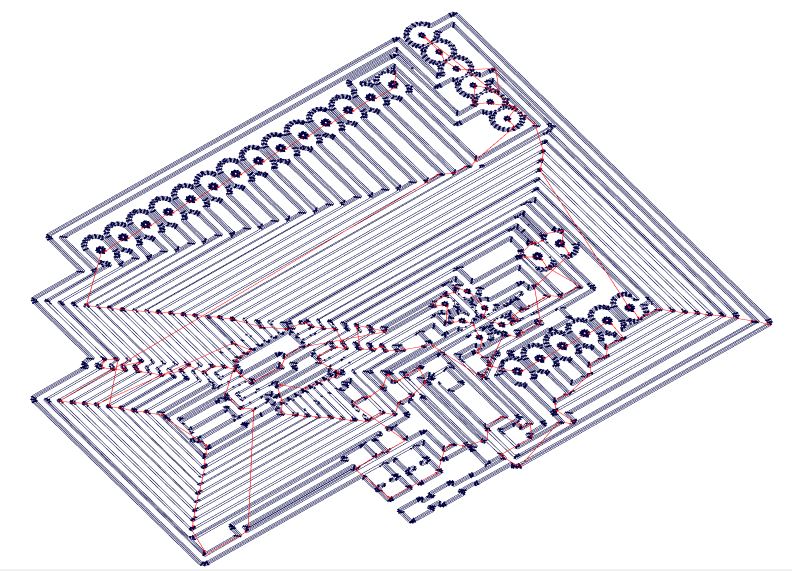
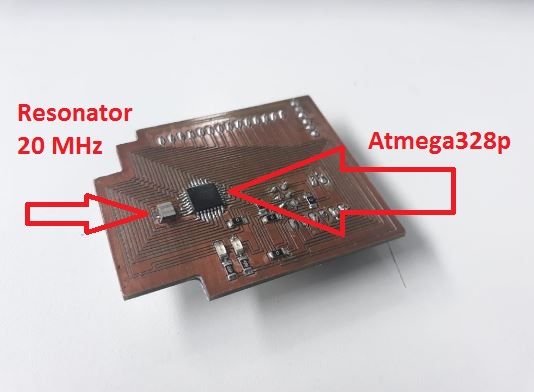
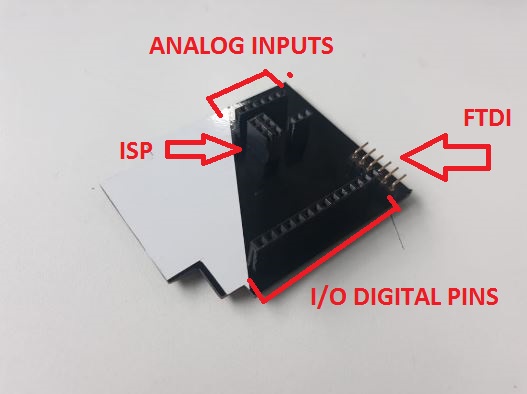
Circuit conection
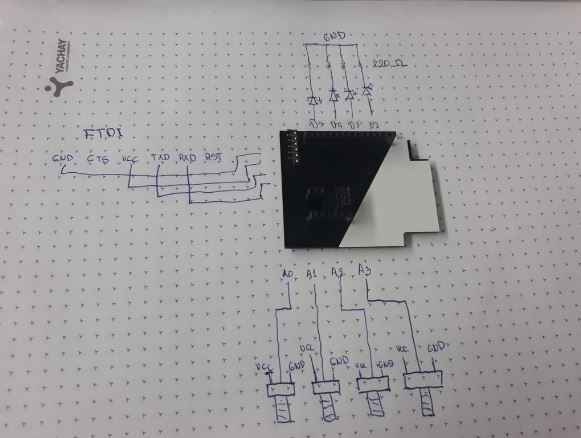
Programming
int led1=2;
int led2=3;
int led3=4;
int led4=5;
int sensor1;
int sensor2;
int sensor3;
int sensor4;

int Readsensor1;
int Readsensor2;
int Readsensor3;
int Readsensor4;
boolean status=LOW; //Estado del led

void setup()
{
  Serial.begin(115200);
  pinMode(led1,OUTPUT);
  pinMode(led2,OUTPUT);
  pinMode(led3,OUTPUT);
  pinMode(led4,OUTPUT);
}

void loop()
{
  Readsensor1 = analogRead(A0);
  sensor1 = map(Readsensor1,0,1023,0,160);
  Readsensor2 = analogRead(A1);
  sensor2 = map(Readsensor2,0,1023,0,160);
  Readsensor3 = analogRead(A2);
  sensor3 = map(Readsensor3,0,1023,0,160);
  Readsensor4 = analogRead(A3);
  sensor4 = map(Readsensor4,0,1023,0,160);
  Serial.print(sensor1);
  Serial.print(",");
    Serial.print(sensor2);
  Serial.print(",");
    Serial.print(sensor3);
  Serial.print(",");
    Serial.print(sensor4);
  Serial.println(",");
  delay(150);

if(sensor1>100){
  digitalWrite(led1,1);
  }
  else{
    digitalWrite(led1,0);
    }

if(sensor2>100){
  digitalWrite(led2,1);
  }
  else{
    digitalWrite(led2,0);
    }

    if(sensor3>100){
  digitalWrite(led3,1);
  }
  else{
    digitalWrite(led3,0);
    }

    if(sensor4>100){
  digitalWrite(led4,1);
  }
  else{
    digitalWrite(led4,0);
    }

}
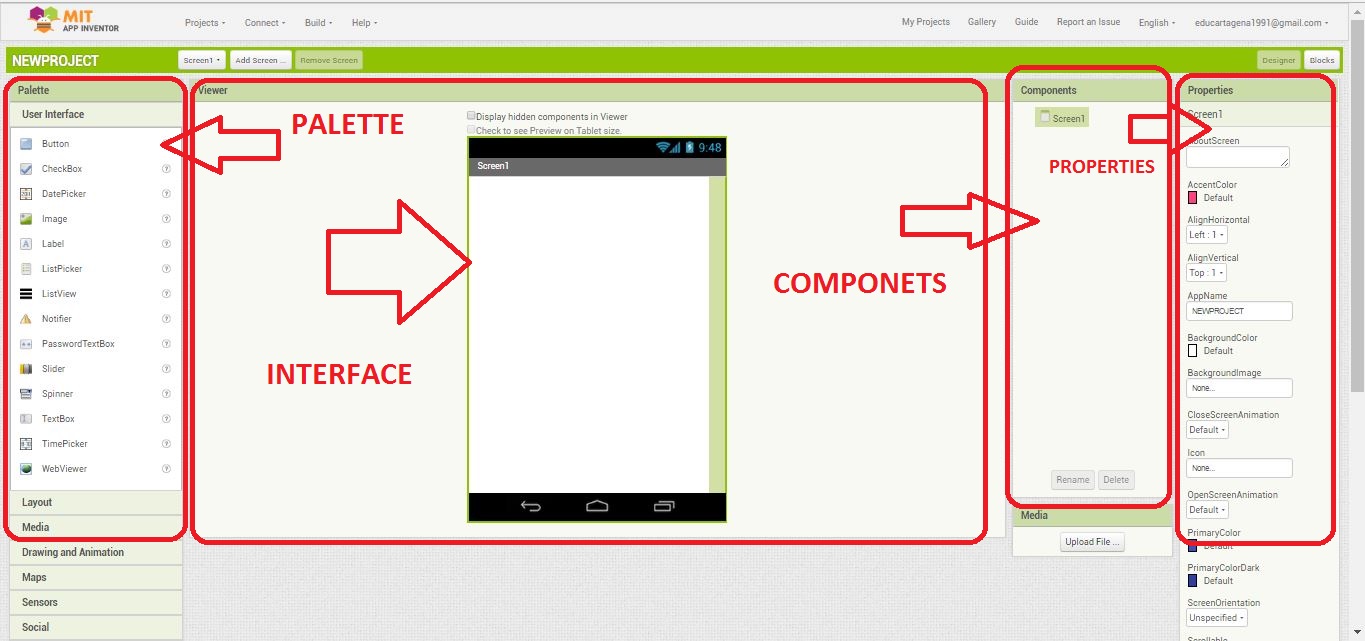
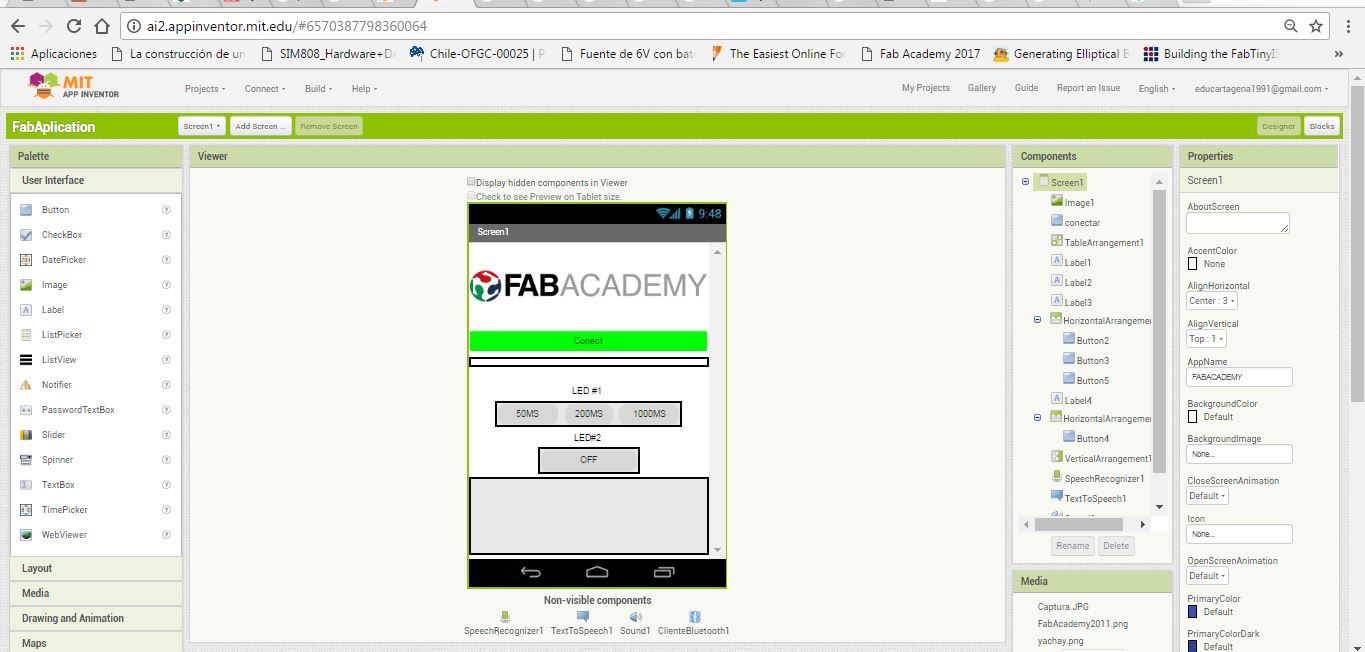
MIT APP INVENTOR

I have also decided to design a mobile application using App Inventor for Android is an open-source web application originally provided by Google, and now maintained by the Massachusetts Institute of Technology (MIT).
It allows newcomers to computer programming to create software applications for the Android operating system (OS). It uses a graphical interface, very similar to Scratch and the StarLogo TNG user interface, which allows users to drag-and-drop visual objects to create an application that can run on Android devices. In creating App Inventor, Google drew upon significant prior research in educational computing, as well as work done within Google on online development environments.
The application that I designed will be used the following week to wirelessly control the lighting of 2 leds
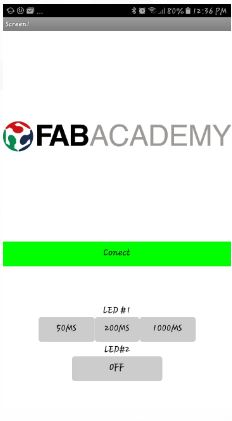
Interface design
Block programming
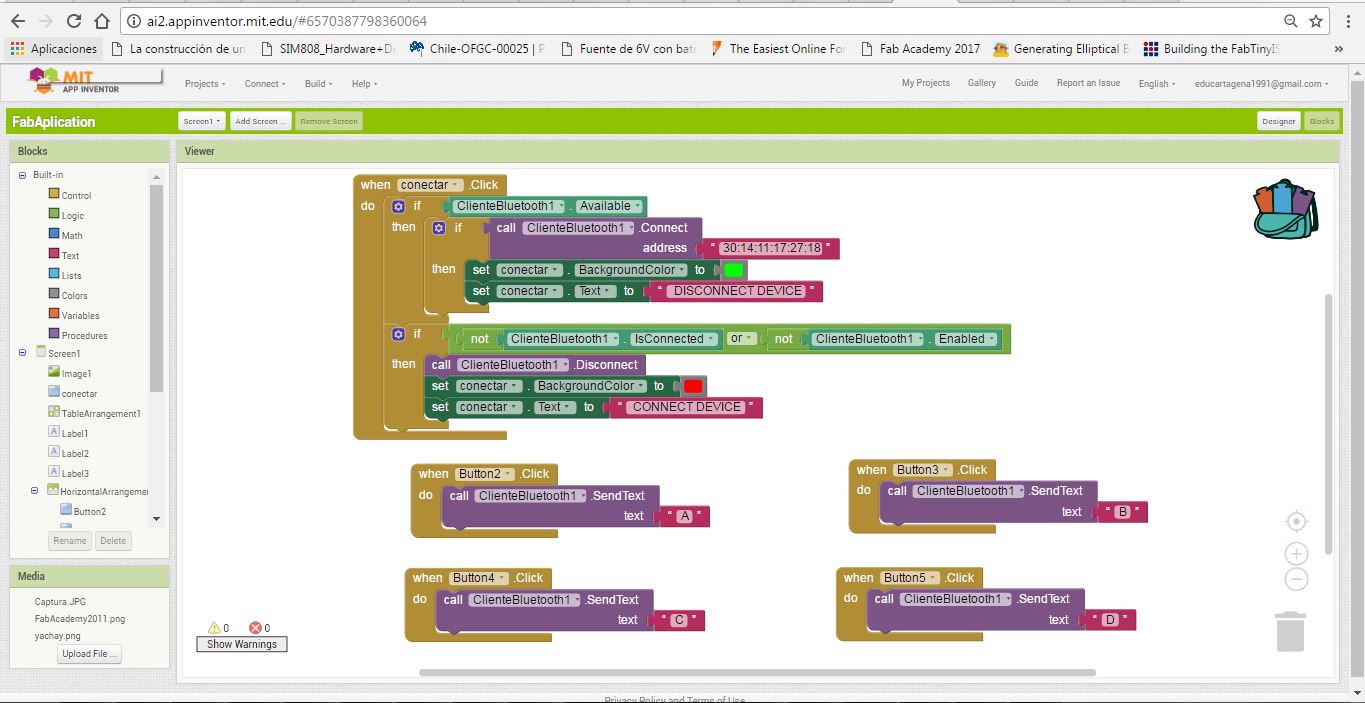
When the button is pressed "Connect" try to connect via bluetooth with the MAC address indicated, if you find the device, the button will change to green, else the connect button will turn red
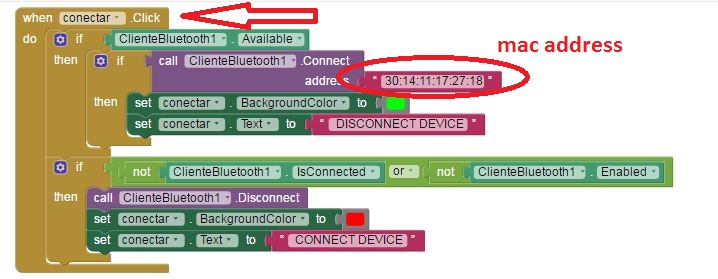
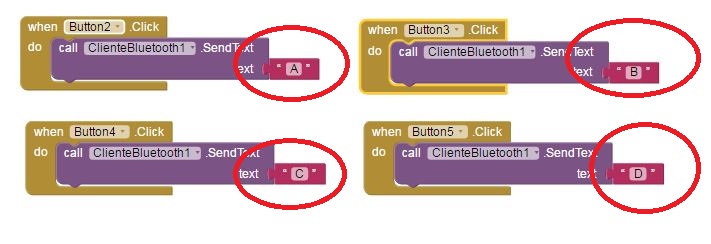
When the device is connected by pressing the on and off buttons, characters will be sent, which must be recognized by the microcontroller to perform the actions of turning the LEDs on and off
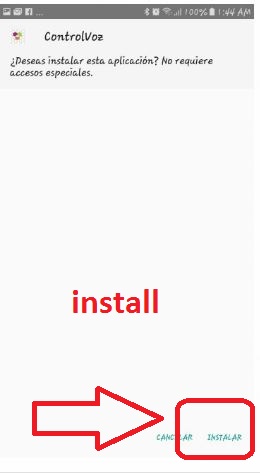
Build application and load it on the cell phone with android operating system
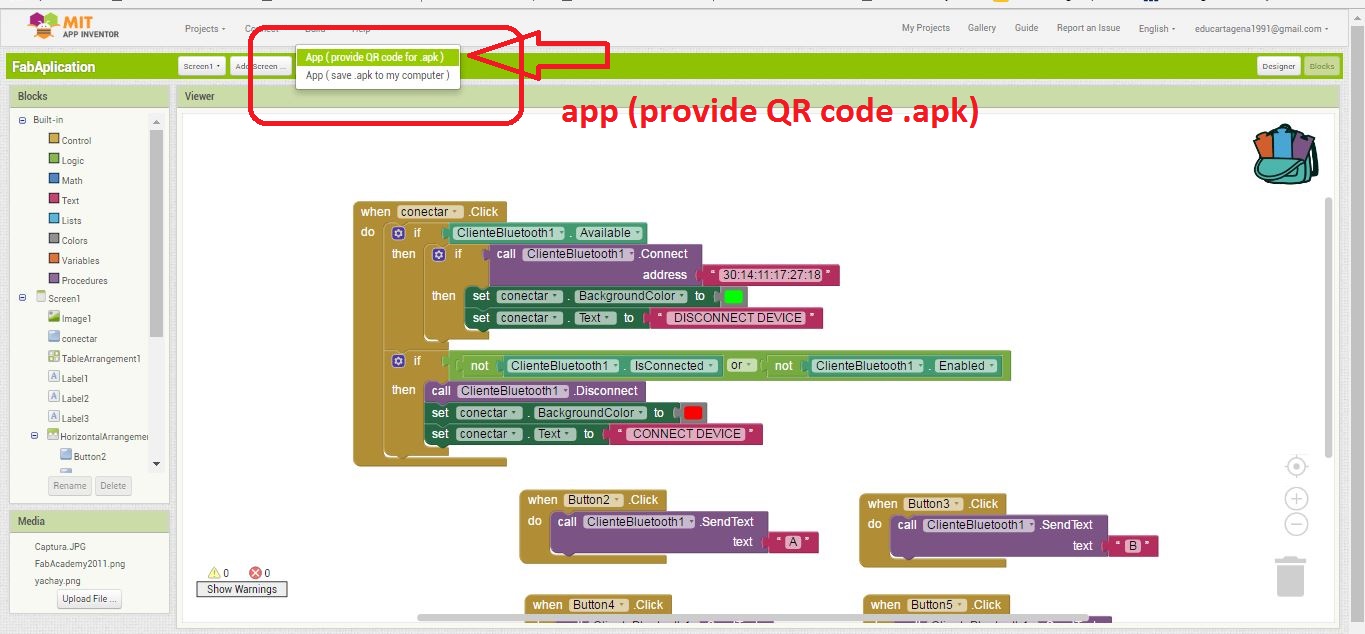
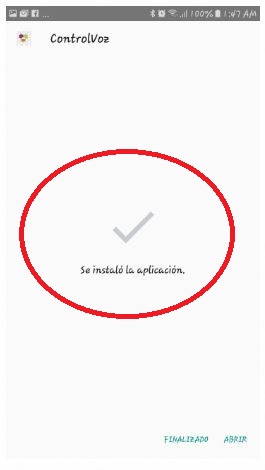
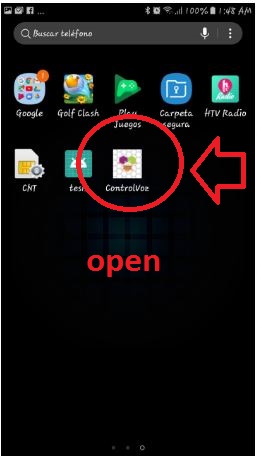
Scan QR Code and install de application

Result
Result
ARDUINO PROGRAMMING
void setup() {
  // put your setup code here, to run once:
 Serial.begin(9600);
 pinMode(13,OUTPUT);
}

void loop() {
  // put your main code here, to run repeatedly:

 if (Serial.available() > 0) {
   delay(300);
    char letra = Serial.read();
Serial.print(letra);
   if(letra == 'A'){
    digitalWrite(13,1);
    }
   if(letra == 'B'){
       digitalWrite(13,0);
    }
       if(letra == 'C'){
    digitalWrite(12,1);
    }
           if(letra == 'D'){
    digitalWrite(12,0);
    }
   }
}
The connection was made using bluetooth technology, all the information related to this technology will be explained the following week of Networking and communications
Outlined problems and how you fixed them
In this assignment I did not have any considerable problems
Included original code

DOWNLOADS
- File 1: Arduino Programming
- File 2: Eagle Files
- File 3: Processing Programming
- File 3: APP INVENTOR FILE