11. Input devices
Objectives of this week are:
1- To measure something by adding a sensor to a microcontroller board that we have designed and read it.
2- As group, probe an input device’s analog levels and digital signals.
Group assignment
Please check the group assignment by clicking on the link here.
Testing the pressure sensor
This week I have tested one of the pressure sensors that I have which is MPXV7025DP. The first step taken was to download and read the datasheet of the sensor. The main features of the sensor are listed below:
1- Pressure range = -25kPa to 25kPa (-3.6 to 3.6 psi).
2- Output voltage = 0.2v to 4.7v.
3- Accuracy = 5%.
4- Supply voltage = typical 5 volts DC.
5- Sensitivity = 90 mV/kPa.
In the datasheet, I was searching about the pins and how to make the circuit connection so I can test out the sensor. In the datasheet there were all the packages of MPXV7025 series. Since I am using MPXV7025DP and I know that the package of it is 1351-01, I was searching about this particular case. There were two different styles of connections mentioning in the datasheet: style 1 and style 2.
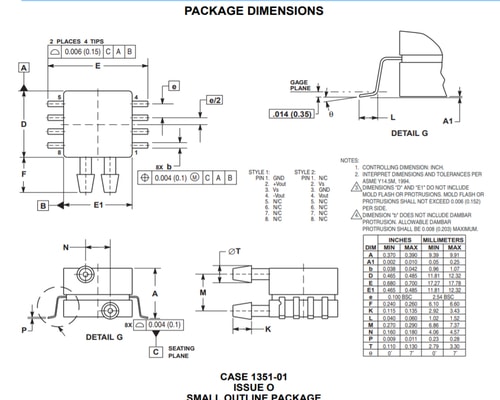
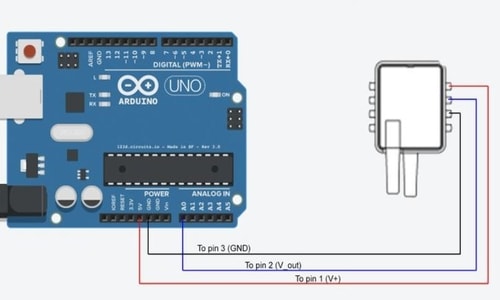
In style 1, pin 1 should be connected to the ground, pin 2 to +Vout, pin 3 to Vs, pin 4 to -Vout and all other pins are not connected to anywhere. In style 2 connection, pin 1, 5, 6, 7, 8 are not connected to anywhere, pin 2 to Vs, pin 3 to ground and pin 4 to Vout.
Since I was planning to use ATMEGA328P as a micro-controller for testing, I decided to connect the sensor in style 2 where pin2 connected to the 5 volts of the Arduino, ground to ground and Vout to the analog pin of the micro-controller. The recommended circuit connection was mentioning in the datasheet in page 4. The figure of the recommended circuit is showing below:
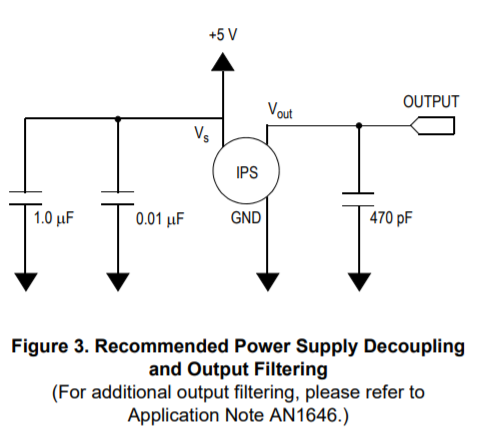
Decoupling capacitors are connected to the supply voltage to filter out voltage spikes and pass through only the DC component of the signal. The idea is to use a capacitor in such a way that it shunts, or absorbs the noise making the DC signal as smooth as possible. The 470pF capacitor is connected to the output as a filter to reduce the noise. For additional output filtering, there was another document mentioned “Application Note AN1646”.
Anyway, as a start, I decided to go with the basic connection by adding a single capacitor in the output. Since the sensor come as SMD package, I was not able to use the breadboard or the vero-board for testing. Hence, I decided to make a PCB and add header for each pin. I used Eagle software from Autodesk to draw the schematic and make the PCB. All the required libraries have been installed from snapEDA website. I have made the PCB using 1-layer board and Roland mill SRM-20 machine to mill the tracks and the outline. The figure below shows all the steps:
1- I have redrawn the recommended circuit from the datasheet in Eagle.
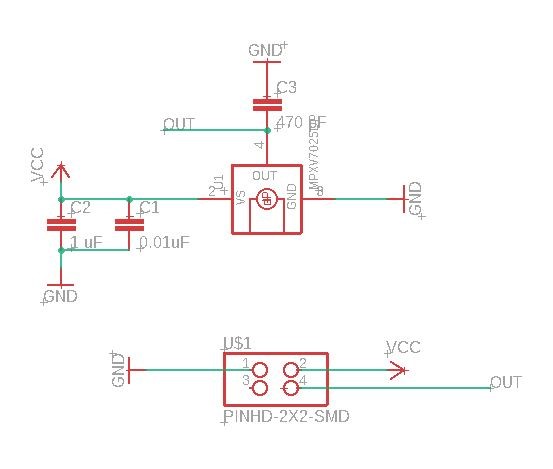
2- Then, I switched to board to make the PCB.
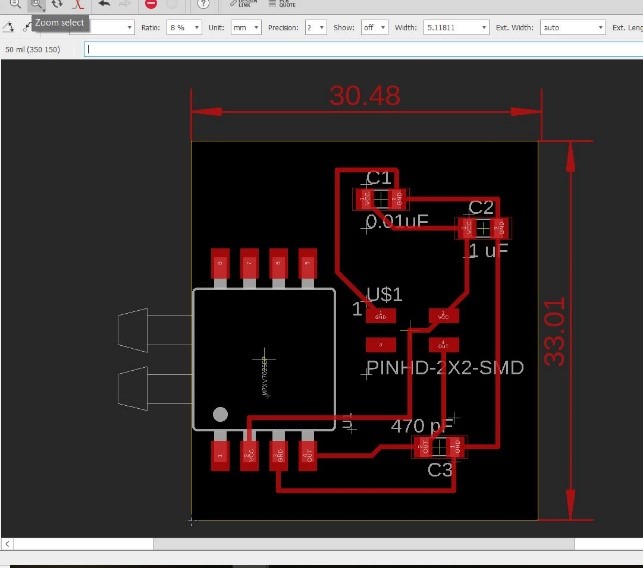
3- Using GIMP, I have created the outline picture and the traces picture. For the outline file, I have inverted the image in the fab modules.
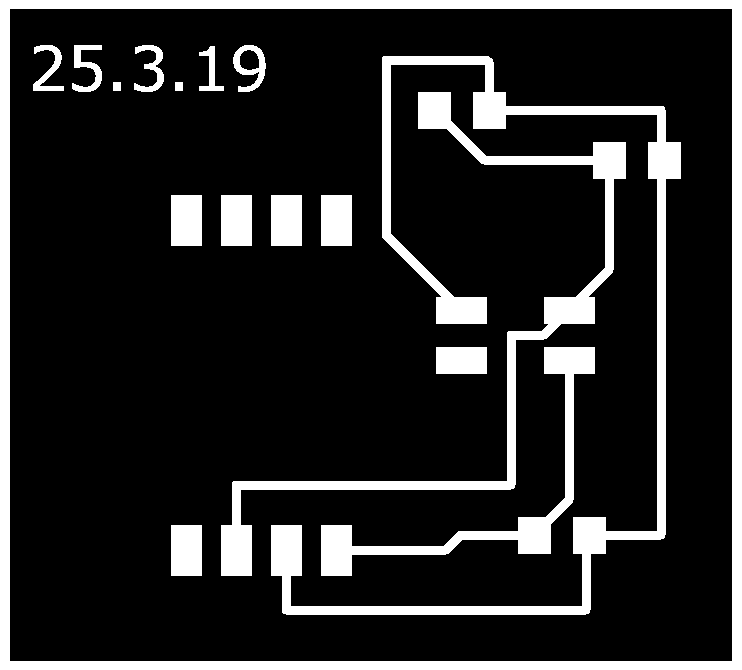

4- Then, I milled the PCB using Roland Mill SRM-20 machine. After that, I started soldering the components.
.jpg)
Micro-controller design
I decided to use the ATmega238P micro-contoller to build my own Arudnio board which will be used later in my final project as well as the coming assignments.
About the ATmega238P:
-
Operating Voltage: 1.8 - 5.5V
-
6-channel 10-bit ADC (Analog-to-digital convertors)
-
Six PWM Channels
-
Two 8-bit Timer/Counters and one 16-bit Timer/Counter
-
High Endurance Non-volatile Memory Segments
-
23 Programmable I/O Lines
Check the datasheet of the ATMEGA328P micro-controller by clicking on this link. The figure below shows the pins layout of the micro-controller Atmega328P:
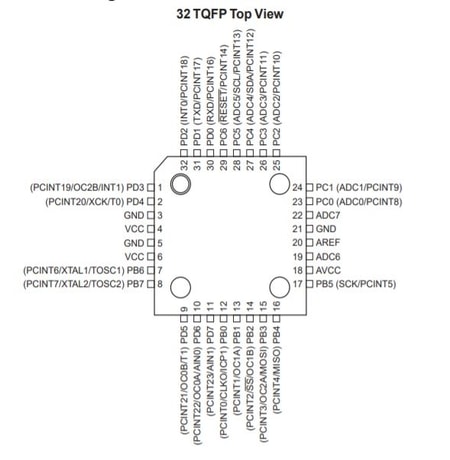
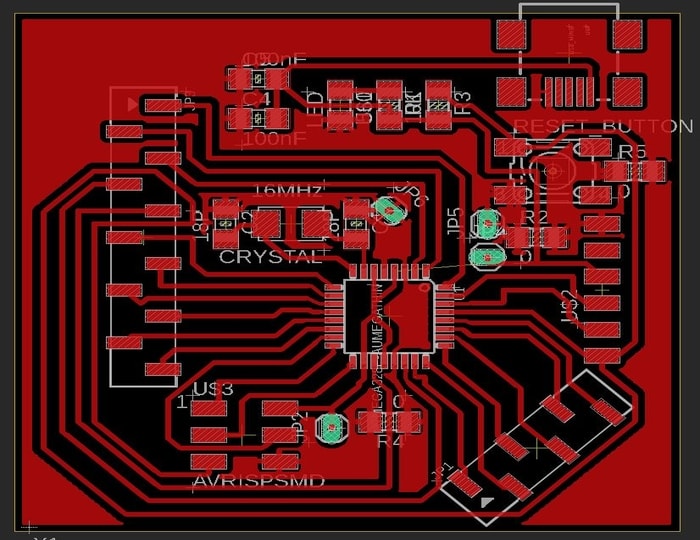
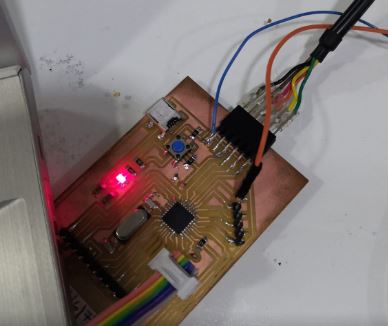
Using this micro-controller I have designed my own Ardunio board. It contains decoupling capacitors, 16MHz external oscillator, LED connected to the VCC, microUSB for power, ISP headers, FTDI cable headers, push button for reset, analog pins and digital pins.
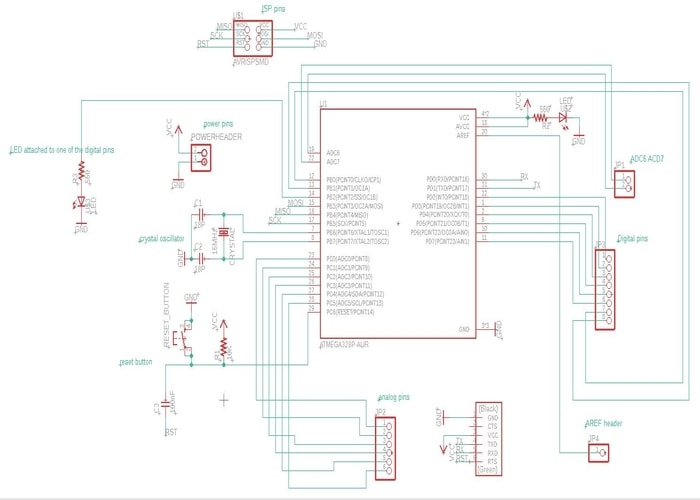
Circuit schematic of the designed ardunio board
The deisnged PCB of my own ardunio board
Then, I have exported the board as image and using GIMP I have created the traces file and the outline file for milling
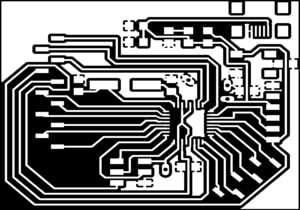
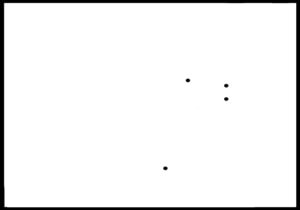
Then, I have used the fab modules to mill the circuit using the milling machine SRM20
.jpg)
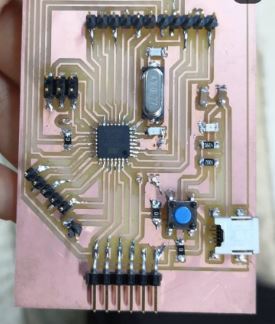
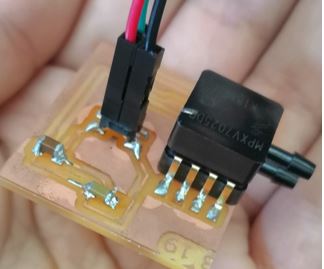
Sensor connection with my own ardunio board
The figure below shows how I have connected the MPXV7025DP sensor with my own designed ardunio board.
| Sensor pin | Circuit pin |
|---|---|
| VCC | VCC (5V) |
| GND | GND |
| Vout | Analog pin (A0) |
Programming and outcome
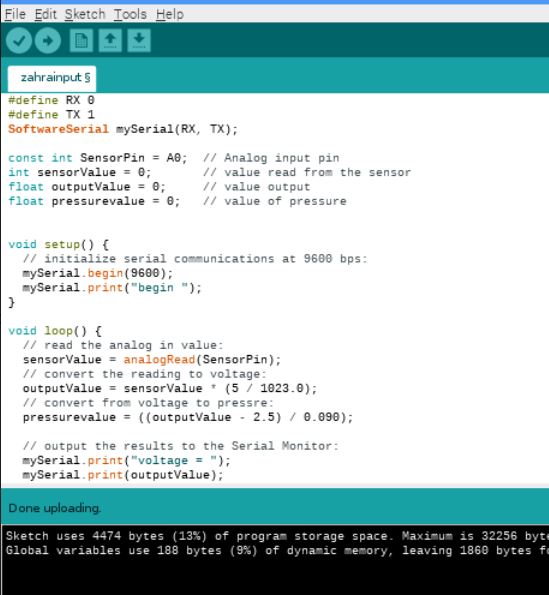
The following program has been written to calculate the value of pressure from the sensor. I am firstly reading the sensor value. Then, I am converting the value into the corresponding voltage. Then, from the voltage I am caculating the pressure.
// Pressure sensor program - zahra almukhariq - fab academy 2019

#include <SoftwareSerial.h>
#define RX 0
#define TX 1
SoftwareSerial mySerial(RX, TX);

const int SensorPin = A1;  // Analog input pin
int sensorValue = 0;       // value read from the sensor
float outputValue = 0;     // value output
float pressurevalue = 0;   // value of pressure


void setup() {
  // initialize serial communications at 9600 bps:
  mySerial.begin(9600);
  mySerial.print("begin ");
}

void loop() {
  // read the analog in value:
  sensorValue = analogRead(SensorPin);
  // convert the reading to voltage:
  outputValue = sensorValue * (5 / 1023.0);
  // convert from voltage to pressre:
  pressurevalue = ((outputValue - 2.5) / 0.090);

  // output the results to the Serial Monitor:
  mySerial.print("voltage = ");
  mySerial.print(outputValue);
  mySerial.print("\t pressure value = ");
  mySerial.println(outputValue);

  // wait 2 milliseconds before the next loop for the analog-to-digital
  // converter to settle after the last reading:
  delay(2);

}
From this program I was excepting some certain values according to the datasheet output graph that is in page 4.
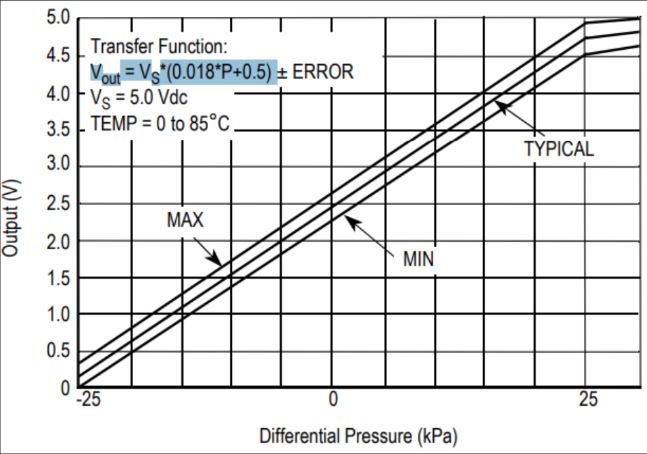
From the above graph that is taken from the sensor datasheet, we can see that when there is no pressure difference (differential pressure = 0) then, the output voltage from the sensor should be 2.5V. As we keep increasing the pressure difference, the output voltage will increase as well. At the maximum kPa value which is 25 kPa, the output voltage will reach around 4.7V. The sensor gives an output as voltage, hence to get the value of the pressure difference, we can use the formula provided in the graph.
Vout = Vs * (0.018*p +0.5), where Vs is the input voltage and it’s equal to 5 volts. To calculate the delta p:
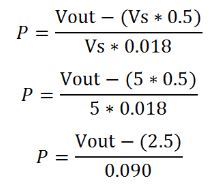
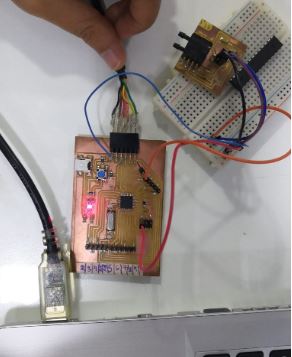
To test this theory, I have connected the sensor to my own ardunio board and output the results in the serial monitor. The steps are below:
1- I have connected the programmer to my PC.
2- I have connected the programmer to the ISP headers of my own ardunio baord.
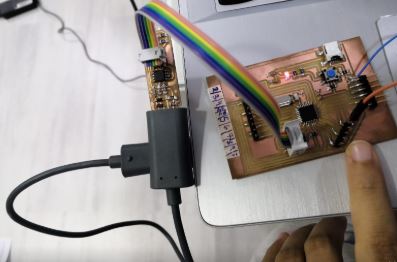
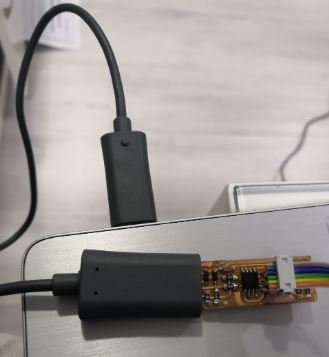
3- I have connected the FTDI cable to my own ardunio board for serial monitoring and to provide power to my circuit.
4- I have uploaded the program.
5- I have connected the sensor to the board as explained ealier. (after the program was uplaoded, I have take off the programmer and only kept the FTDI cable to monitor the data in serail)
6- When there was no pressure applied on the sensor, I have noticed that the values are near to what is excepted. The figure below shows the result in serial monitor.
.jpg)
7- My circuits were working correctly and give the expected preformance. As when I was applying more pressure on the sensor, the voltage was increased and the pressure value was increasing as well. When applying pressure on the other side, the voltage was decresed and pressure value decresed as well. The video below demostrate the final result.
Download orginal files
download the schematic file of the ardunio board from here.
download the PCB file of the ardunio board from here.
download the code from here.