16. Interface and application programming
The task of this week is to nterpret and implement design and programming protocols to create a Graphic User Interface (GUI). Also, this week I worked on defining my final project idea and started to getting used to the documentation process.
Group Assigment
Check the group assignment from this link.
Hardware and bluetooth connection
For this week, I have decided to create and build a mobile app to display a sensor values in it. The sensor will be connected to my micro-contoller board that I have designed and build in week 11. The micro-controller board will be also connected to a bluetooth module so the data of the sensor can be transmit to the mobile app. The mobile app will be designed and built to disply numbers (values of the sensor).
The first step taken is to connect the sensor and the bluetooth module to the micro-controller board and program it in a way to transmit the data to the mobile app by bluetooth.
Overview
The Bluetooth module HC-05 has been chosen and used to transmit data wirelessly to a mobile app.
The module has the following specification:
• Supply voltage = 4V to 6V (Typically +5V).
• Communication method = Serial communication.
• Operating current: 30mA.
• Range = <100 m.
• Supported baud rate: 9600,19200,38400,57600,115200,230400,460800.
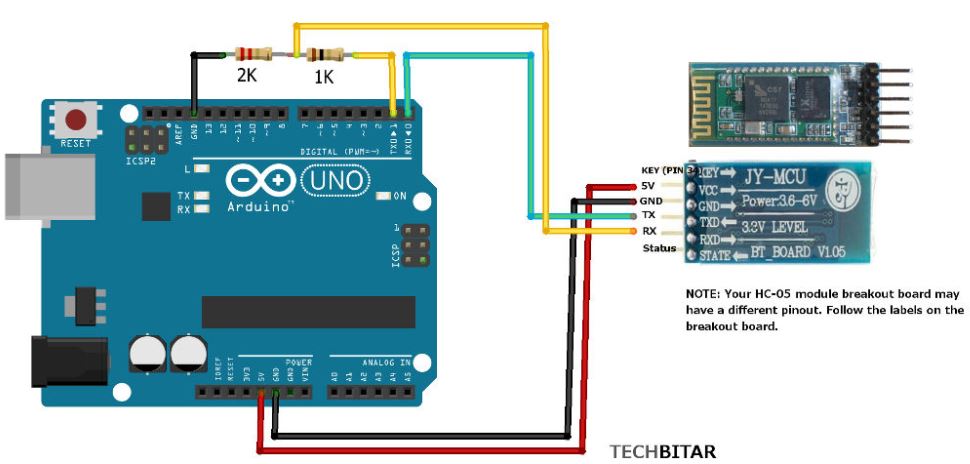
The Bluetooth has been connected to my micro-controller board as following:
| Bluetooth module pin | Micro-controller pin |
|---|---|
| VCC | Vin |
| GND | GND |
| RX | TX |
| TX | RX |
The ciruit below show how the bluetooth module should be connected to a micro-controller ATMEGA328P:
Finally the code should be uploaded in the micro-controller board. Please note that the code should be uploaded first, then the Tx and Rx wires connected. It has been found that the upload will not occur while the Tx and Rx wires are connecting.
Workflow
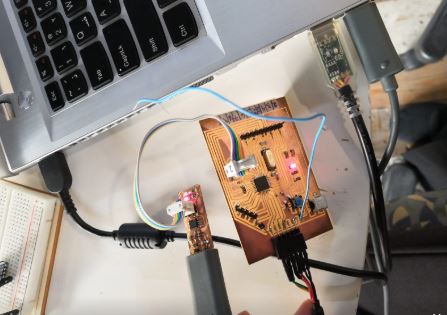
The first step taken is connecting the micro-controller board into my PC using my own programmer and the FTDI cable. By this connection I was able to program the board and upload the code.
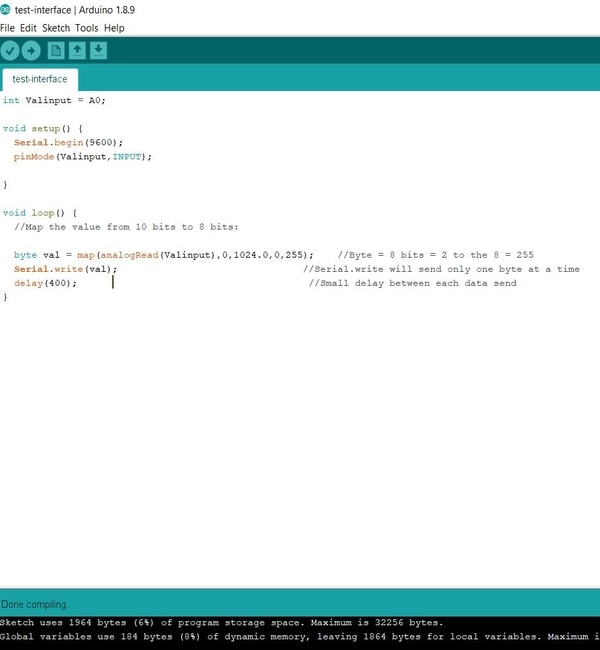
After that, I have written the following code in the Arduino IDE:
int Valinput = A0;

void setup() {
  Serial.begin(9600);
  pinMode(Valinput,INPUT);

}

void loop() {
  //Map the value from 10 bits to 8 bits:

  byte val = map(analogRead(Valinput),0,1024.0,0,255);    //Byte = 8 bits = 2 to the 8 = 255
  Serial.write(val);                                //Serial.write will send only one byte at a time
  delay(400);                                        //Small delay between each data send
}
Then, I have compile the code to make sure that there is no error
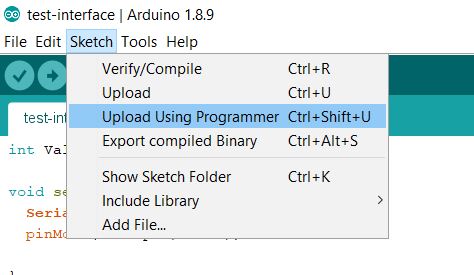
Then I have chosen the correct port and upload the program
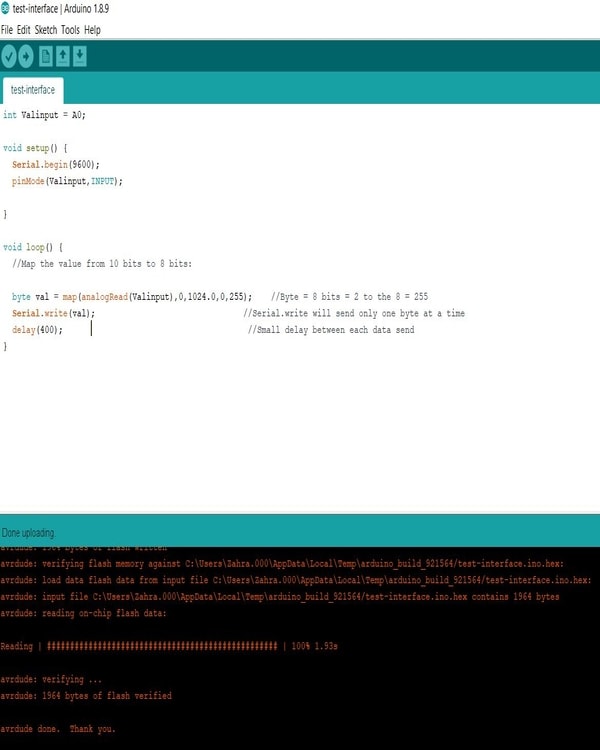
Note: when I clicked on the upload icon, there was error accour while uploading. The code was uploaded when I clicked on the “Upload using programmer” option.
After the code was successfully uploaded, I have connected the bluetooth module to the micro-controller board as shown on the Bluetooth circuit connection above.
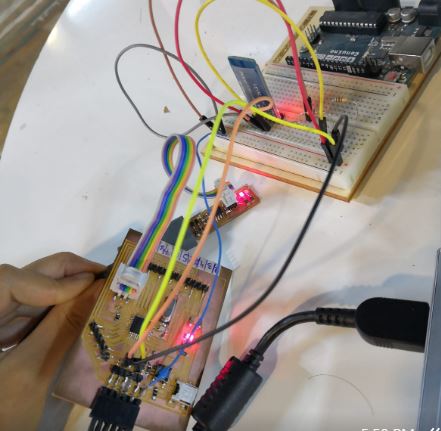
Finally, I have connected the sensor (pressure sensor) to the analog pin in my circuit.
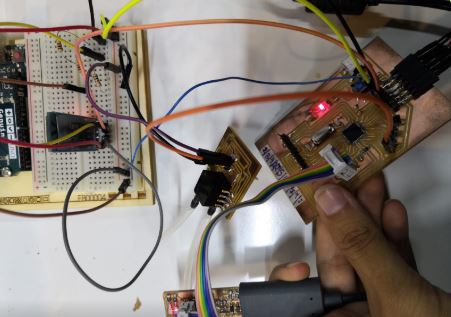
The connection now is complete. The sensor is connected to the micro-controller board. The blutooth module is connected as well. Everythings is working, as I have displayed the sensor output on the serial monitor of Arduino IDE. The bluetooth module is blinking which means it transmitting the data. Now I will move to the mobile app side.
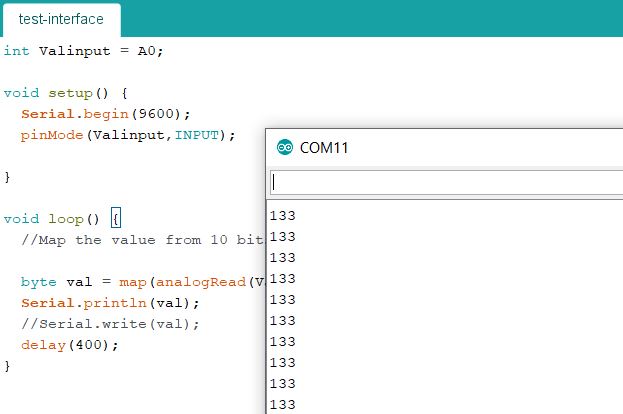
Note: this is the final code that I have written to display the sensor values on the serial monitor and to make sure that everything is working fine.
int Valinput = A0;

void setup() {
  Serial.begin(9600);
  pinMode(Valinput,INPUT);

}

void loop() {
  //Map the value from 10 bits to 8 bits:

  byte val = map(analogRead(Valinput),0,1024.0,0,255);    //Byte = 8 bits = 2 to the 8 = 255
  Serial.println(val);
  //Serial.write(val);                                //Serial.write will send only one byte at a time
  delay(400);                                        //Small delay between each data send
}
This is the output in the serial monitor:
MIT App Inventor
Now, moving to the app, the app has been created using the MIT App Inventor. The MIT App Inventor has been chosen and used because there are many tutorials available online on how to output a sensor values in it. Also, the programming language of it is not very difficult as it is easy to follow and understand. The data of the sensor has been sent via the module to the app by pairing the mobile with the Bluetooth module.
The picture below shows the home page of the website

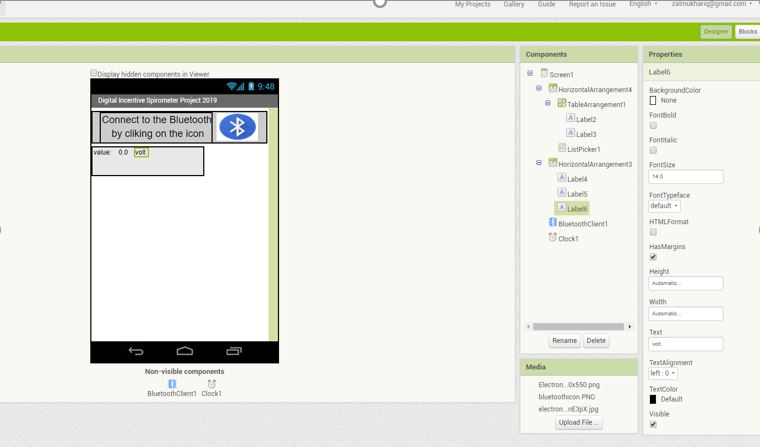
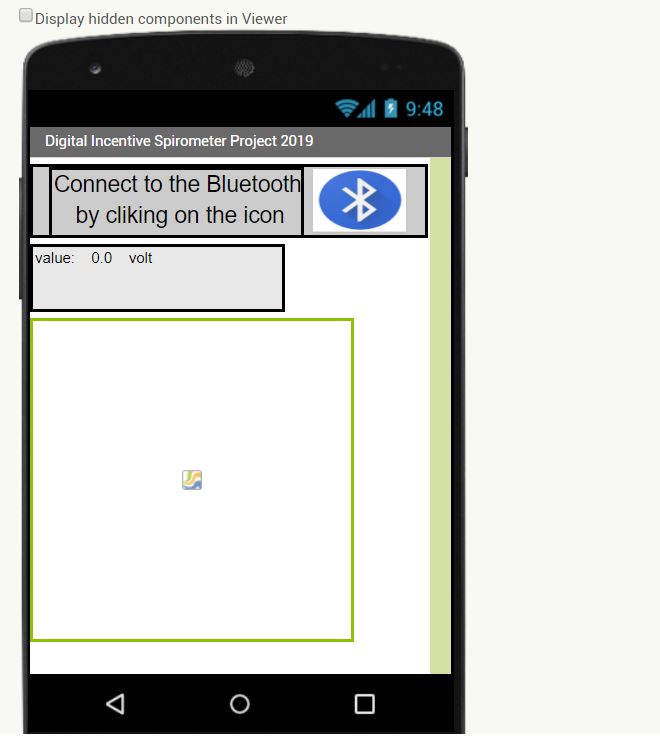
So, I have clicked on the “Create Apps!” to start creating my mobile app. The picture below shows the design window where all the components of the app have been set. Components used such as: labels, canvas (for plotting graph), Bluetooth and clock. From the properties window in the right side I have edited the sizes, names, text colors, etc.
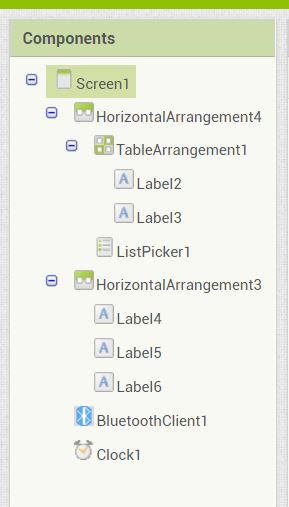
Here is the list of all the components that I have added:
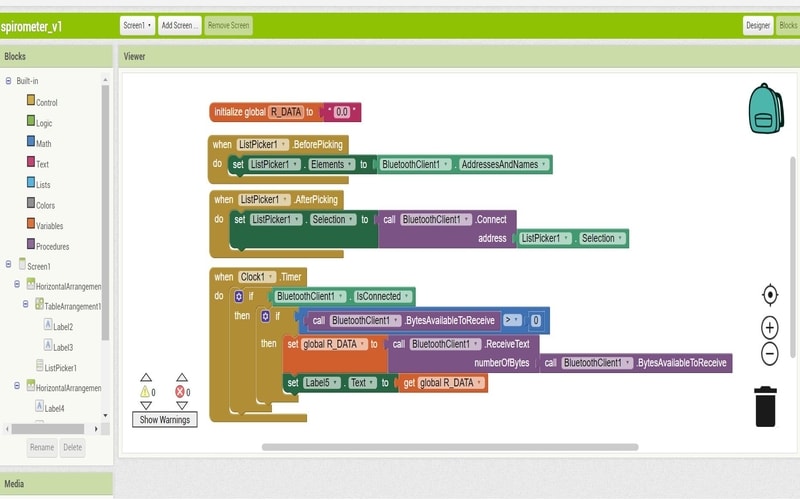
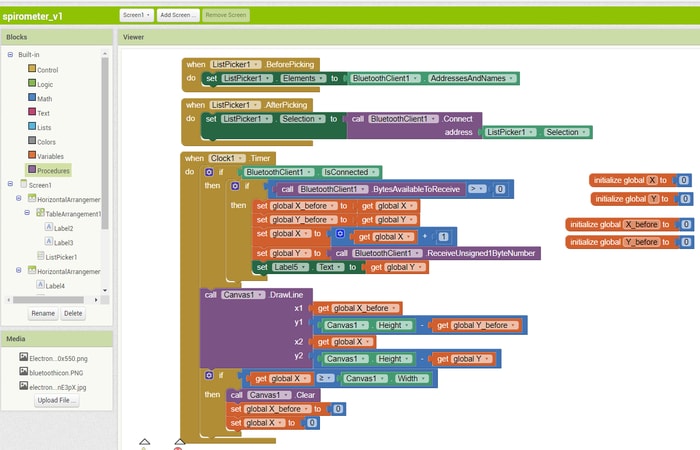
The picture below is the blocks window and it shows the code written for the app. Firstly, the variables have been initialized. Then, the connection with the mobile app set when the user selects the Bluetooth device. Finally, when the Bluetooth is connected, we start receive the values of the sensor into the app.
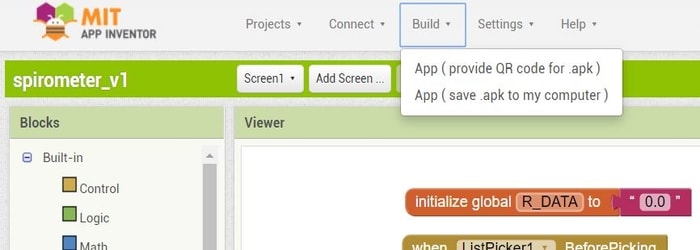
Finally, I have save the app in my PC and transfer it to my phone.
Note: My phone is Huawei Nova 3, therefore, I was not able to downlaod any app that is not from google play until I enable a premission for that.
Therefore, I have go to setting > Security & privacy > More settings > Install apps from external sources.
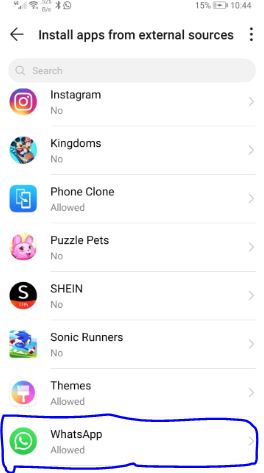
After downloading the app, it was installed in my phone:
![]()
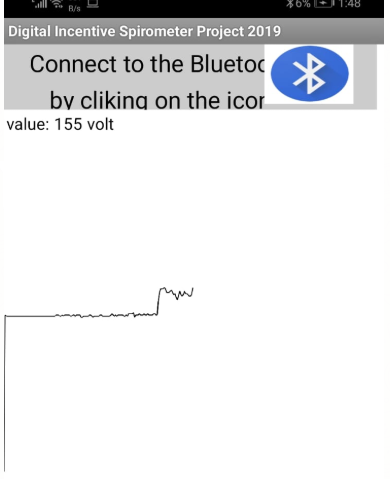
Here is the designed app in the mobile
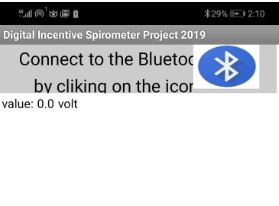
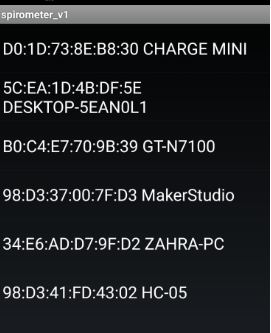
To connect the mobile app to the bluetooth module, I have clicked on the Bluetooth icon, then from the list I have chosen the HC-05
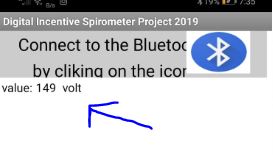
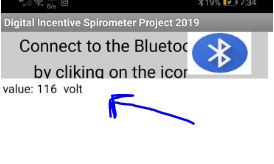
After that, I saw the values appear
The mobile app is displaying the values of a pressure sensor. It is a differential pressure sensor. So applying a pressure on any of the ports will cause a change in the values. Therefore, I have attached tubes and I was blowing on the sensor to see the values increasing and decreasing.
The following video shows how the values are changing based on the side I am blowing
After displaying the values and everything was working correctly, I decided to enhance and develop the app by adding a real-time graph to it. And here are the steps:
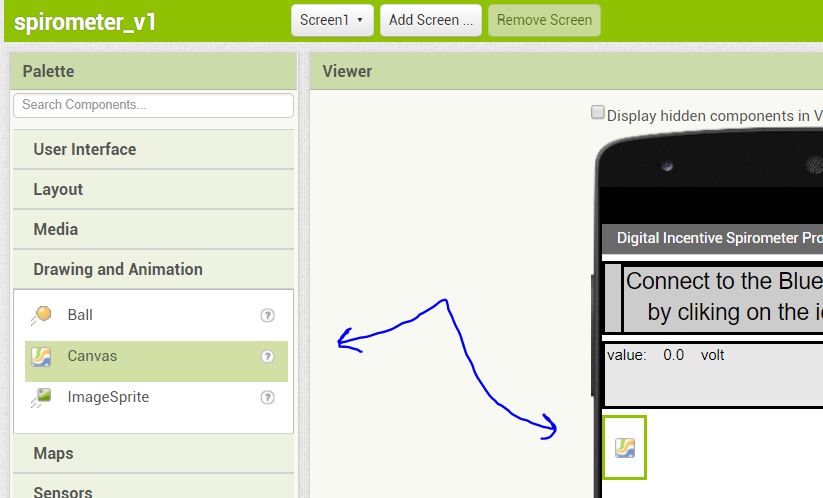
1- From the Plaette column, I have added canvas.
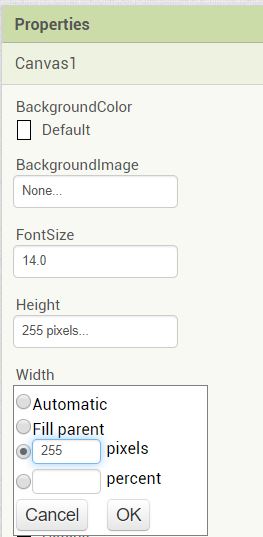
2- Then, I have changed the size of it from the Properties column.
3- This is how the window looks after adding the real-time graph
4- Then, moving to the blocks, I have initialize variables for X and Y and the canvas block to control the graph. Here is the edited block daigram.
5- Then I have built the app again and downlaod the new version in my PC then to my phone
6- I have connected the app to the Bluetooth module as explained before.
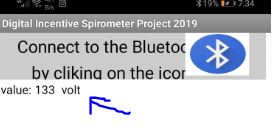
7- As you can see in the figure below. the values (data) when there was no pressure applied in 133. And this is the set point
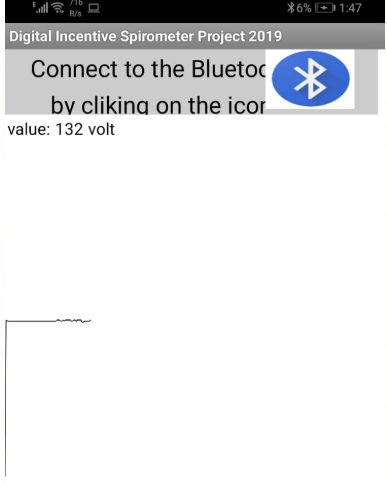
8- Then, when I was blowing on one side, the values increased. Therefore the graph goes up.
9- Then, when I was blowing on the other side, the values decreased. Therefore, the graph goes down.
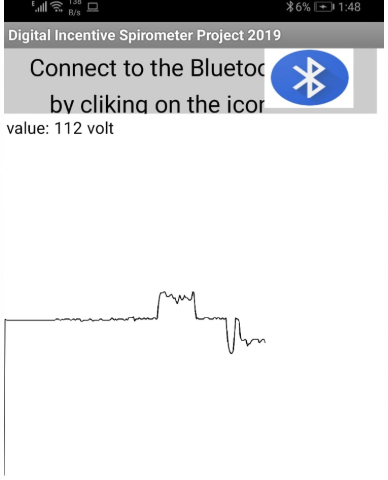
10- The following video shows how the numbers and graph are changing in the mobile app while I was blowing in the tubes of the pressure sensor.
Original files
The files of the mobile app and the Ardunio code can be downlaoded from below