16. Interface and Application Programming
Oh boy.
Learning outcomes - Interpret and implement design and programming protocols to create a Graphic User Interface (GUI).
Have you? - Described your process using words/images/screenshots - Explained the the GUI that you made and how you did it - Outlined problems and how you fixed them - Included original code (or a screenshot of the app code if that’s not possible)
Background
Help! Computers is magic.
What I did
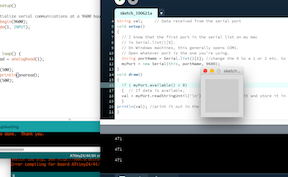
SInce I am not a programmer, I decided to keep it relatively simple and plot the temperature as measured by a thermistor with Processing and Arduino. I started by downloading Processing and installing it. Next, I started to follow the Arduino tutorial for it, making sure my pins and everything where what they were supposed to be and modifying as needed for the board. I’m using my LED Blink board from week 6 (Tx = 0, Rx = 1). The serial port for Processing should be “1” on my MacBook, FYI. Did the hello world test.

Cool - so I redid it with the thermistor board from networking week to send over the analog reading.
Arduino Code:
#include <SoftwareSerial.h>

//int thermistor = 1;
//int Tx = 2;
//int Rx = 3;
int anaread;

SoftwareSerial Test(3, 2);


void setup()
{
//initialize serial communications at a 9600 baud rate
Test.begin(9600);
pinMode(1, INPUT);

}


 void loop() {
anaread = analogRead(1);

delay(500);
Test.println(anaread);
delay(500);
}
Processing Code:
import processing.serial.*;

Serial myPort;  // Create object from Serial class
String val;     // Data received from the serial port
void setup()
{
  // I know that the first port in the serial list on my mac
  // is Serial.list()[0].
  // On Windows machines, this generally opens COM1.
  // Open whatever port is the one you're using.
  String portName = Serial.list()[1]; //change the 0 to a 1 or 2 etc. to match your port
  myPort = new Serial(this, portName, 9600);
}
void draw()
{
  if ( myPort.available() > 0)
  {  // If data is available,
  val = myPort.readStringUntil('\n');         // read it and store it in val
  }
println(val); //print it out in the console
}
Great! Now let’s convert the reading to a temperature that we used before and plot that! I snagged the sample code for it from the Arduino Tutorial, and let’s see how it goes! I also grabbed the math I used in the networking week to convert the analog reading to a temperature, and fixed the variables to make sure everything matches up properly.
The Arduino code is the same, so we just need to change the Processing Code:
import processing.serial.*;

  Serial myPort;        // The serial port
  int xPos = 1;         // horizontal position of the graph
  float inByte = 0;
  float tempF = 70;

  void setup () {
    // set the window size:
    size(400, 150);

    // List all the available serial ports
    // if using Processing 2.1 or later, use Serial.printArray()
    println(Serial.list());

    // I know that the first port in the serial list on my Mac is always my
    // Arduino, so I open Serial.list()[0].
    // Open whatever port is the one you're using.
    myPort = new Serial(this, Serial.list()[1], 9600);

    // don't generate a serialEvent() unless you get a newline character:
    myPort.bufferUntil('\n');

    // set initial background:
    background(0);
  }

  void draw () {
    // draw the line:
    stroke(127, 34, 255);
    line(xPos, height, xPos, height - tempF);

    // at the edge of the screen, go back to the beginning:
    if (xPos >= width) {
      xPos = 0;
      background(0);
    } else {
      // increment the horizontal position:
      xPos++;
    }
  }

  void serialEvent (Serial myPort) {
    // get the ASCII string:
    String inString = myPort.readStringUntil('\n');

    if (inString != null) {
      // trim off any whitespace:
      inString = trim(inString);
      // convert to an int and map to the screen height:
      inByte = float(inString);
    float vT = inByte*5.15/1024.0;
    float rT = 10000*vT/(5.15-vT);
    float tempC = 3750.0*295.0/(3750.0+295.0*log(rT/10000.0))-273.0;
    tempF = (tempC * 1.8 + 32);
      println(tempF);
      inByte = map(tempF, 0, 1023, 0, height);
    }
  }
Holy crap it works! Yay! The plot is pretty linear, but you can see the number going up in the bottom there.
Discussion
I did have some problems getting Serial to work on the Arduino side, but that is usually solved by me flipping the Rx and Tx pins back and forth until what I expect to show up in the Serial Monitor shows up there. I liked using Processing, since it gave you programming errors as you went. And temperature plots are helpful in something like this so you can keep track of trends and potentially calculate stuff like heat transfer coefficients or some awesome heat transfer stuff like that.