16. Interface and application programming⚓︎
Graphical User Interfaces are one of the most crucial elements in our daily lives, as they have become the way in which we interact with the whole technological world around us. Both a good and a bad GUI can completely change our experience with a product or a service, so I find it very stimulating to know a little more about this field and see how to approach it. Here are the Assesment Criteria related to Interface and Application Programming:
-
- Compare as many tool options as possible.
-
Individual assignment
- Write an application that interfaces a user with an input and/or output device that you made.
-
Learning outcomes
- Interpret and implement design and programming protocols to create a Graphic User Interface (GUI).
-
Have you?
- Linked to the group assignment page.
- Documented your process.
- Explained the UI that you made and how you did it.
- Outlined problems and how you fixed them.
- Included original code (or a screenshot of the app code if that’s not possible).
- Included a ‘hero shot/video’ of your application running with your board.
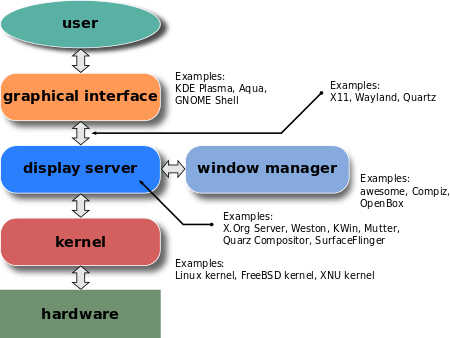
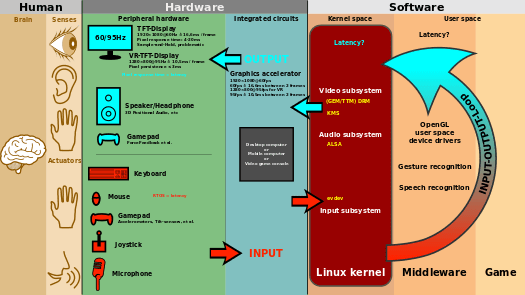
I’m completely new to GUIs, but Neil has introduced several tools in the class that seem very interesting and relatively easy to tackle. These are some sketches I found that define which part of a whole program is the GUI and how they place in the layer order as the only one that we, as users, can interact with.
My first aproach will be to work with the inputs I developed back at week 10 and create an interface that modifies or reacts to the measures of the sensor. Programming languages like Processing are pretty suitable for this task. Later, I will try to make a simple phone app with MIT App Inventor to maybe include it in my final project, as I want to be able to determine the desired time span through the phone, like a timer in an alarm clock.
Input device⚓︎
The sensor I am going to use to send values that can be represented in the different interfaces is going to be the same one I used and for which I created a board in the Input Devices week. It is an ultrasonic sensor that returns distance values. In this case I have modified the code to try to send as many pulses as possible to get smoother visual representations. The delay between values sent to the serial has been reduced from 1000 ms to 200 ms and I have added some limitations to avoid getting erroneous values as valid, setting limits to the data to be represented. This is the modified code:
const int PIN_Echo = 4;
const int PIN_Trigger = 3;
const int PIN_Led = 2;

void setup() {
    Serial.begin(115200);
    pinMode(PIN_Trigger, OUTPUT);
    pinMode(PIN_Echo, INPUT);
    pinMode(PIN_Led, OUTPUT);
}

void loop() {
    int CM = ping(PIN_Trigger, PIN_Echo);

    //Serial.print("Distance: ");
    if (4 <= CM <= 400)
        Serial.println(CM);
    if (CM > 400)
        Serial.println("Invalid measures. Farther than 4m.");
    if (CM < 4)
        Serial.println("Invalid measures. Closer than 4cm.");

    digitalWrite(PIN_Led, HIGH);
    delay(100);
    digitalWrite(PIN_Led, LOW);
    delay(100);
}

int ping(int PIN_Trigger, int PIN_Echo) {   //function to calculate distance
    long duration;
    long distanceCM;

    digitalWrite(PIN_Trigger, LOW);  //to generate a clean pulse set to LOW 4us
    delayMicroseconds(4);
    digitalWrite(PIN_Trigger, HIGH);  //we generate Trigger of 10us
}
Processing⚓︎
Processing is a language very similar to Arduino, in fact it predates it, and can be considered its precursor. This programming language or tool allows to create through code all kinds of visual representations based on geometrical concepts. In the web OpenProcessing we can find wonders, and even games, created with this tool.
To introduce us to this language, the tool itself has a very direct hello Proccesing course and even some tutorials, although in my case I have decided to follow some classes that Marta Verde, the instructor of Fab Lab IED, gave in FabLab Leon a couple of years ago and that our instructors have provided us with.
First trial⚓︎
I started downloading Processing from the official webpage. After that, I tried to replicate, and then play on with some of the sketches Marta showed during the class. As first concepts, the program structure is also identical to Arduino, there is a void setup() function to initialise or define configuration parameters, and another void draw() function (same function as void loop()) that will loop the code in it. Here are some basic commands I learnt to get started:
size(px,px): to set the size of the window in pixels (heigth, width).background(R,G,B,T): to set the color of the window’s background (by default it’s grey). You have four channels here, three for RGB and the last one for the transparency (0 to 255 values). You can also use just one parameter to set it as greyscale(background(B&W)).stroke(R,G,B,T): to set a color for any shape. You can also usenoStroke(R,G,B,T)to remove the outline.strokeWeight(px): to set the thickness of a point/outline (by default is one pixel).fill(R,G,B,T): to set the infill color of any shape (again with four channels). You can also usednoFill(R,G,B,T)to remove the infill.
We can also find other quick command guides like this Processing cheatsheet which I highly recommend cheking. After understanding some of the basic rules and commands of this language, I decided to start interacting with the ultrasonic sensor. First of all I used Adrian’s code for his Processing Random Colours, to check the serial function in processing and if it was receiving data or establishing communication.
import processing.serial.*;     //librarie for serial

float val;          //variable for the serial data
Serial myPort;      //naming the port variable for serial
float size;

void setup() {
    size(800, 800);               //frame size
    println(Serial.list());       //show on the screen the values of the serial number
    myPort = new Serial(this,"COM4", 115200);  //serial port
    myPort.bufferUntil('\n');
    background(127,255,127);      //background color
    //frameRate(10);              //data capture rate 10 frames per second
}

void draw() {
    size = map(val, 0, 1024, 0, 200);                   //mapping size
    noStroke();
    fill(random(255),random(255),random(255));          //filling of random spheres
    ellipse(random(width), random(height), size, size); //place and size of the sphere

    fill(0); //color del texto
    text(val, width, height);     //value of the measure
}

void serialEvent(Serial myPort) {
    String inString = myPort.readStringUntil('\n');
    if (inString != null) {
        inString = trim(inString);
        float[] values = float(split(inString, ","));
        if (values.length >=1)      //making sure it only reads 1 value at a time
            val = 10 * values[0];   //picks the value from the array(first one)
    }
}
This example draws circles of random colour and position whose size varies according to the values of our sensor. The smaller the distance, the smaller the circles and vice versa. The problem is that our sensor values are too small for the distinction in size or even the circles to be noticeable, as you can see in the first half of the video shown below, so I decided to multiply the sensor values by 10 (val = 10 * values[0]) to make the visual difference more noticeable.
In this case, as Adrian was also using a distance sensor, which only outputs one value, there is no need to modify the function that reads the serial data, as it is configured to collect only one value. If we were using an accelerometer or other input that sends more than one value per data block, we would have to modify the number of values that the array function picks up (if (values.length >=1)). It is also necessary to change the port to which our input is specifically connected, in this case COM4.
Distance bar⚓︎
Once we have a reactive interface to our sensor and the data is handled correctly, it’s time to experiment a bit more with different ways of representing those values. During the sensor classes Neil has always shown examples where the measurements are represented in a bar of values, being a very direct way of visualising data for a more technical representation, so I will try to replicate it. Also other colleagues like Elena Cardiel have done very similar examples before, so I have taken it as a base and modified it on my own to create a more reliable behaviour for my sensor and the range of measures it takes.
import processing.serial.*;

float sensorValue;
Serial myPort;

void setup() {
    size(1024, 200);  //window size (1024=phototransistor max. value)
    myPort = new Serial(this, "COM4", 115200);
    background(255);
}

void draw() {
    noStroke();
        fill(142,47,137,20);
        rect(0, 0, sensorValue, height);

        fill(255,70);
        rect(sensorValue, 0, width-sensorValue, height);

        //println(sensorValue);
        fill(142,47,137);
        text(sensorValue, sensorValue, height/2);
}

void serialEvent(Serial myPort){
    String inString = myPort.readStringUntil('\n');
    if (inString != null){
        inString = trim(inString);
        float[] values = float(split(inString, ","));
            if (values.length >=1){
                sensorValue = values[0];
        }
    }
}
import processing.serial.*;     //librarie for serial

int sensorvalue;    //variable for the serial data
Serial myport;      //naming the port variable for serial

void setup() {
    size(500, 100);     //size of the window(x,y)
    myport = new Serial(this,"COM4", 115200);   //serial port
    background(255);    //background color
    //frameRate(20);    //framerate of the animation
}

void draw() {
    noStroke();     //outline (not drawing outline)
    fill(0,0,170);      //color inside (R,G,B,Transparency)
    rect(0, 0, sensorvalue, height);    //rectangle (position(x,y) and size(x,y))

    //cleaning last value
    fill(255);
    rect(sensorvalue, 0, width-sensorvalue, height);

    println(sensorvalue);   //prints values in console(for debugging)
    fill(0,0,170);
    text(sensorvalue, sensorvalue, height/2);   //(text, x, y)
}

void serialEvent(Serial myport){
    String inString = myport.readStringUntil('\n');
    if (inString != null){
        inString = trim(inString);
        int[] values = int(split(inString, ","));
        if (values.length >=1)      //making sure it only reads 1 value at a time
            sensorvalue = 10 * values[0];   //picks the value from the array(first one)
    }
}
Elena’s code is quite complete but there are elements that I want to modify to get a better result for my sensor, like using a float variable to store the values of the sensor, which I consider is unnecessary for this case. First of all, using a float type variable to store integer(int) values is possible, but not recommended. Both variables occupy 32 bits but it takes more work for the computer to figure out binary problems, like floating-point values, than it does for the computer to work in integers because of the format the 32 bits are divided in distinct parts and because float isn’t truly possible in a binary system (check here if you want more info). The rest of the changes have been about color, size and transparency, as Elena was leaving some ghost frames in between measures to make it look fluidly I think. But I don’t like that effect as it looks laggy so just bumped up the number of values the sensor prints per second. 
Much of the code is commented out to indicate its function, but in summary this code is drawing a rectangle of constant X dimensions and the sensor values for Y, cleaning up the result between frames. The size of the window is set to the range of values that are expected to be provided. The video below shows a test with both codes running on the sensor.
Distance field⚓︎
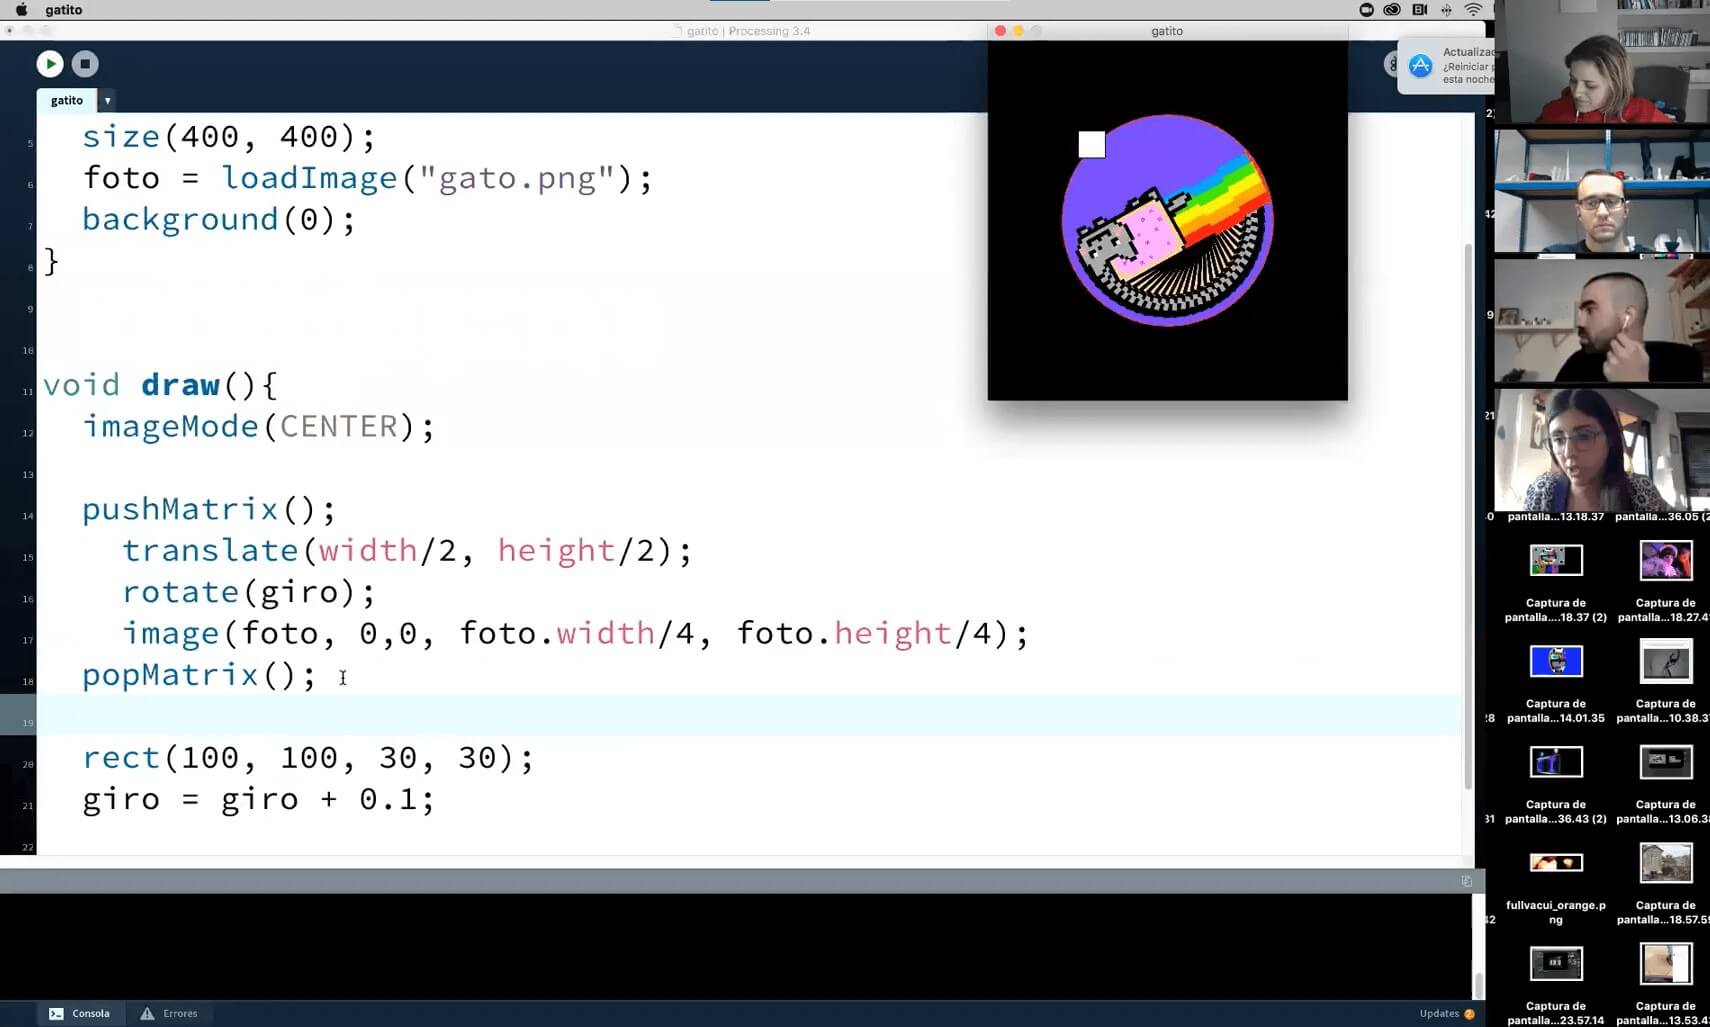
For my last iteration with processing I wanted to do something more visual, so I looked for something cool and adaptable to my sensor type. Finally I picked this sketch from Open Processing, and modifided on my own to make it react to my input in a way it makes sense with the sensor and the type of measure. That’s why i decided to make like a central point which has a grid that goes farther or closer in function of the distance the sensor is measuring.
import processing.serial.*;

Serial myport;
int sensorvalue;

ArrayList<PVector> grd = new ArrayList<PVector>();

void setup() {
    myport = new Serial(this,"COM4", 115200);
    size(800, 800);
    background(100);
    stroke(124,219,183);

    int numW = 50;
    int numH = 50;

    for(int i = 0; i < numW; i++) {
        for(int a = 0; a < numH; a++) {
            PVector temp = new PVector(i * (width/numW), a * (height/numH));
            grd.add(temp);
        }
    }
}

void draw() {
    background(124,219,183);
    for(PVector read : grd) {
        float temp = atan2(read.y - height/2, read.x - width/2);

        ellipse(width/2, height/2, 5, 5);
        translate(read.x, read.y);
        rotate(temp);
        ellipse(sensorvalue/dist(width/8, height/8, read.x/4, read.y/4), 0, 5, 5);
        rotate(-temp);
        translate(-read.x, -read.y);
    }
}

void serialEvent(Serial myport) {
    String inString = myport.readStringUntil('\n');
    if (inString != null) {
        inString = trim(inString);
        int[] values = int(split(inString, ","));
        if (values.length >=1)
            sensorvalue = 10 * values[0] * values[0];
    }
}
To make this representation we use an array of values and two for functions, from which we generate all the points of the mesh, which is defined in void setup. Later in void draw we draw the geometric representation, in this case a circumference, from the data we receive from the sensor. To make the mesh reactive to this geometric representation we use a variable of type float and the function atan2. This function calculates the angle (in radians) from a specified point to the coordinate origin as measured from the positive x-axis. Values are returned as a float in the range from PI to -PI. Then we update the value of our array in each cycle. This is how it looks like with the processing interface:
Group assignment⚓︎
For the final project it would be interesting to have an interface on the mobile, or even to be able to manage the project only from the mobile, so I have decided to try to develop a small basic application as an introduction to the material. Apparently one of the easiest ways to do it is through MIT App Inventor. To connect the phone with our board we are going to use the HC05 Bluetooth module from last week’s group assignment, at Networking and Communications
MIT App Inventor⚓︎
This platform is an intuitive, visual programming environment that allows you to build fully functional apps for smartphones. It’s blocks-based like Scratch (I think the have the same source), which facilitates the creation of complex apps. App Inventor is also cloud-based, which means you can build apps right in your web browser. The website offers all the support you’ll need to learn how to build your own apps. To start creating our own, we just have to visit ai2.appinventor.mit.edu.
Once on the MIT App Inventor website, the interface it’s very intuitive. At the top right corner we have two menus to toggle between them, the Designer and the Blocks menu. The Designer menu is used to place buttons, texts, images, set layouts, include sensor data and many more things that will show up in our App. In the Blocks menu is where we put the logic to all the elements that we have just configured in the App.
App interface⚓︎
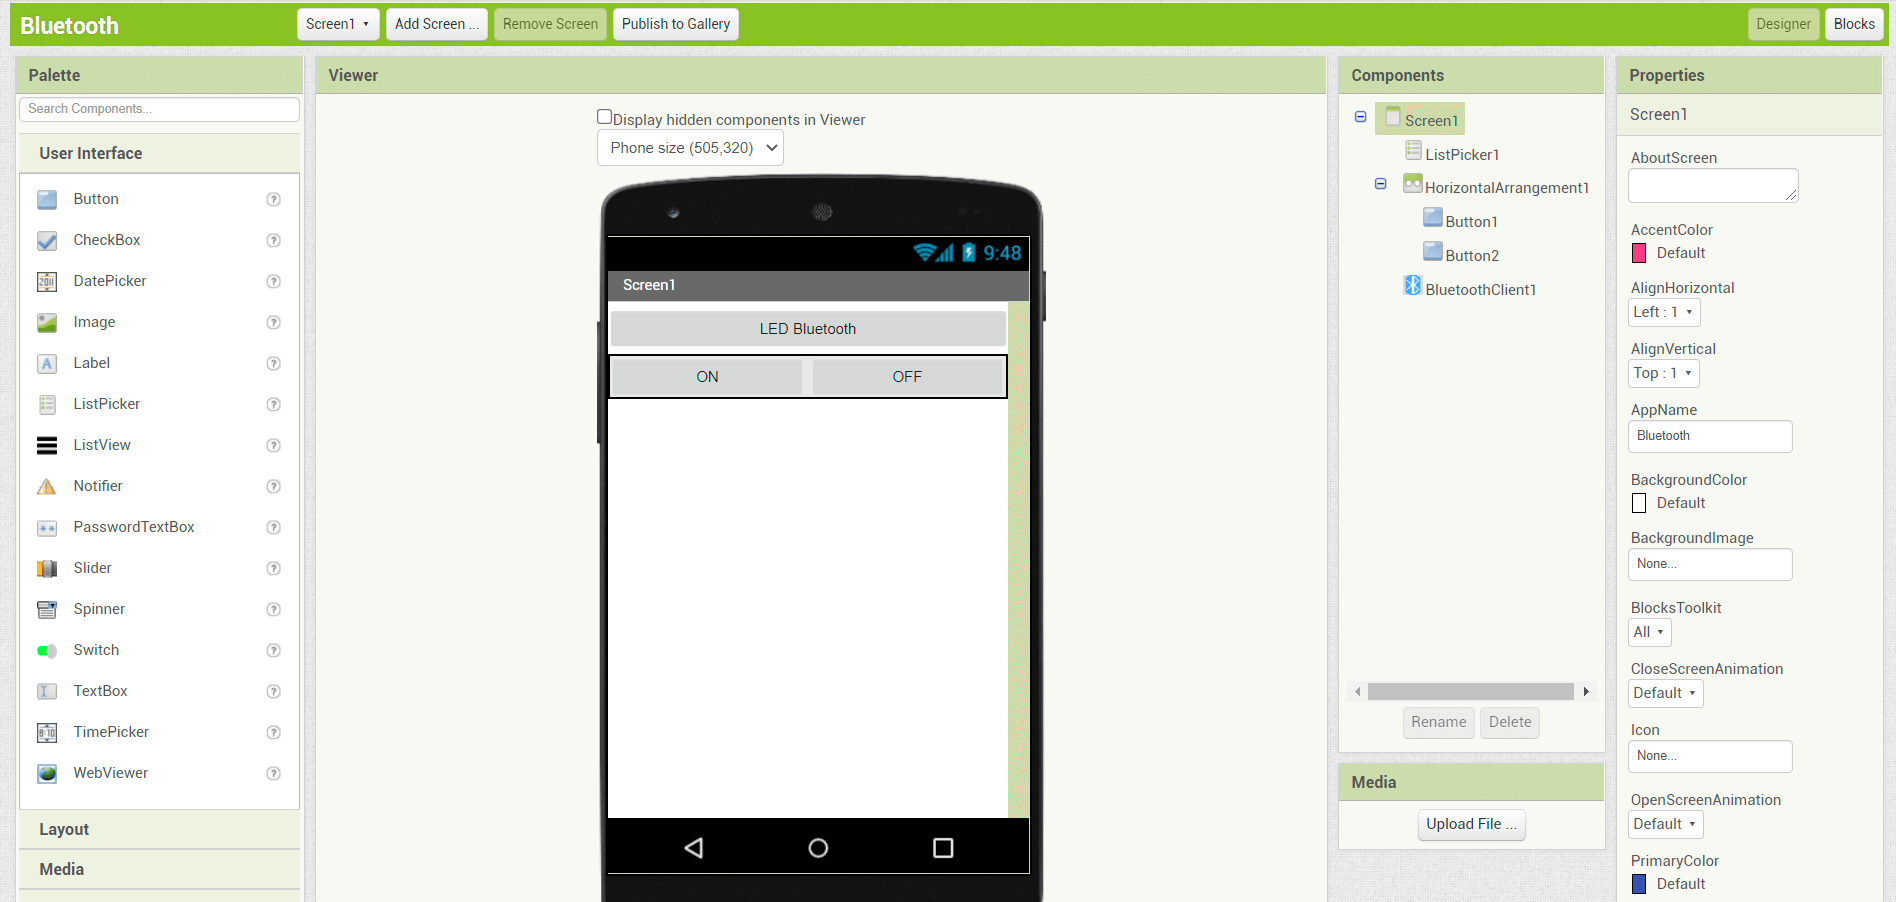
First we should start with the Designer menu. This is where we are going to design the interface of our application. Texts, buttons, sliders or images can be added. In the menu on the left we have all the elements that we can add, and to do so, we just have to click and grab them to the phone simulated screen. For this case we are just going to use 2 buttons and the Bluetooth connectivity feature. It’s as simple as drag and drop! Once the item is on the phone screen, we can select it on the right menu to configure it’s appearance. Shape, position, color, text and function can be configured here. This is what we ended up with:
App blocks coding⚓︎
Once we have finished with the design of the App, we can go to the Blocks menu, where we will create the logic for the App. As I describe earlier, it is very similar to programming in Scratch, but since I haven’t done any coding with this “language” I’ll have to get used to it. On the left we have the different blocks grouped by the elements that we have placed in the design and all the logic and basic programming elements. This is the blocks source code for the App:
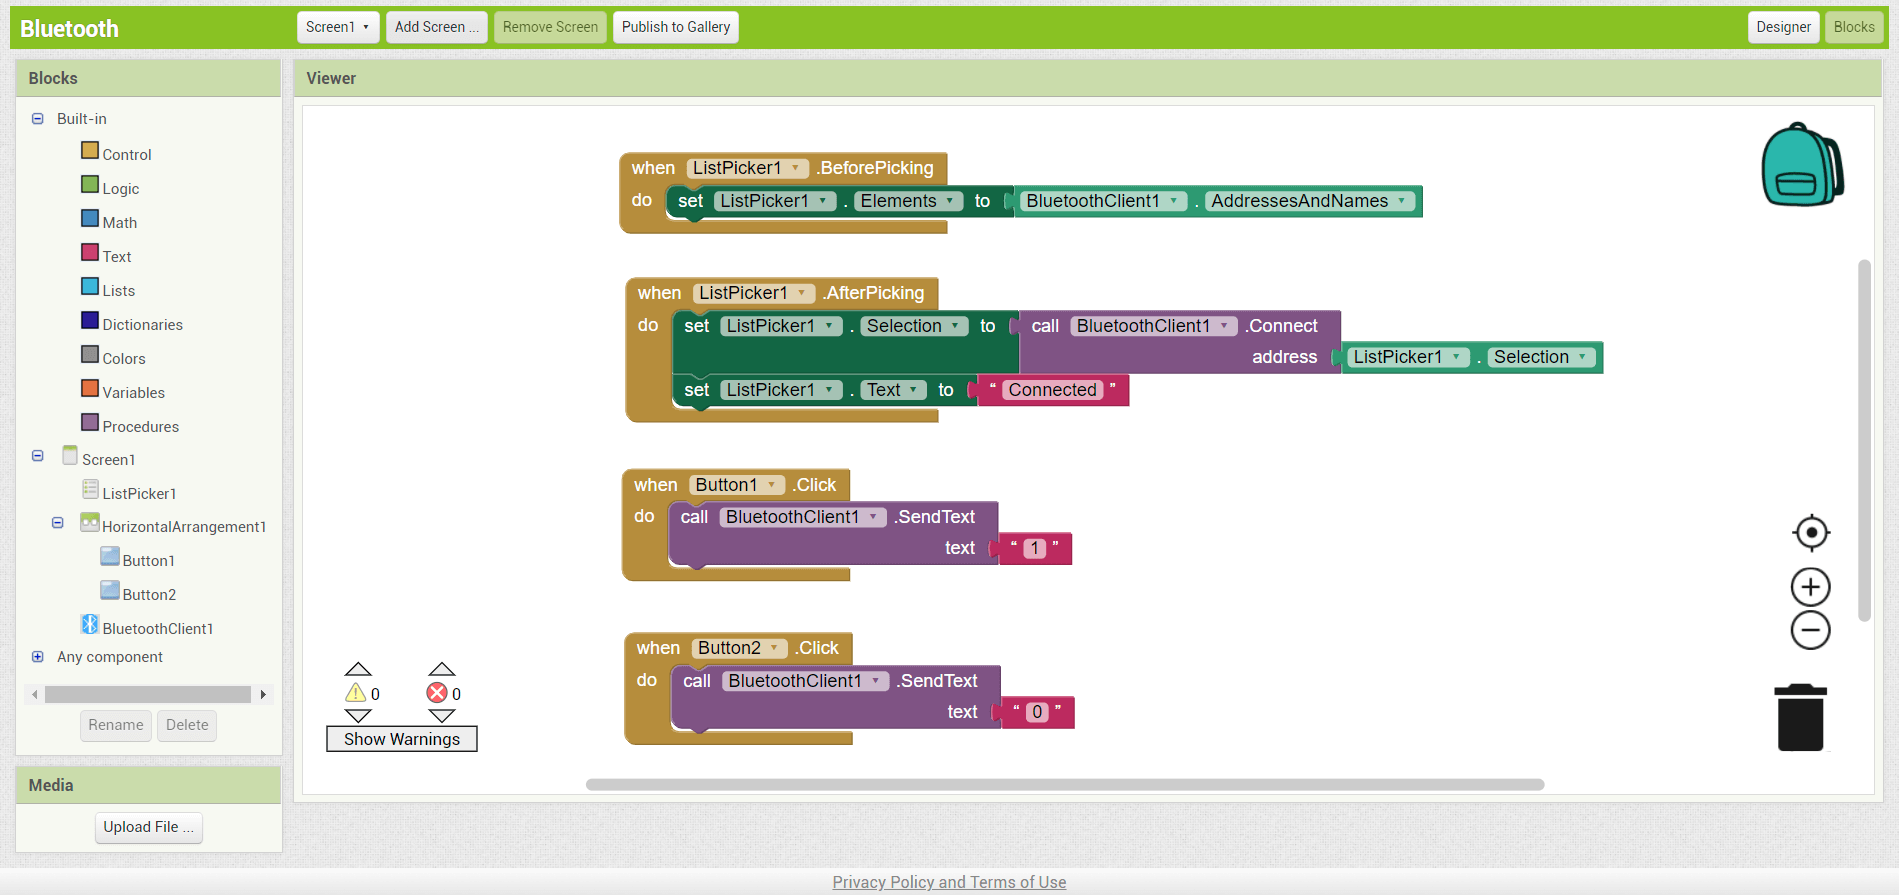
Basically, it establishes connection with the Bluetooth module, and sends 1 when the ON button is pressed and 0 for the OFF one. Then we should match this messages with the code in our board so it can receive this data via BT and through serial, and light up the led accordingly. This is the source code for our board:
char IncomingValue = 0;

void setup() {
    Serial.begin(9600);
    pinMode(8, OUTPUT);
}

void loop() {
    if(Serial.available() > 0) {
        IncomingValue = Serial.read();
        Serial.println(IncomingValue);
        if(IncomingValue == '1')
            digitalWrite(8, HIGH);
        else if(IncomingValue == '0')
            digitalWrite(8, LOW);
    }
}
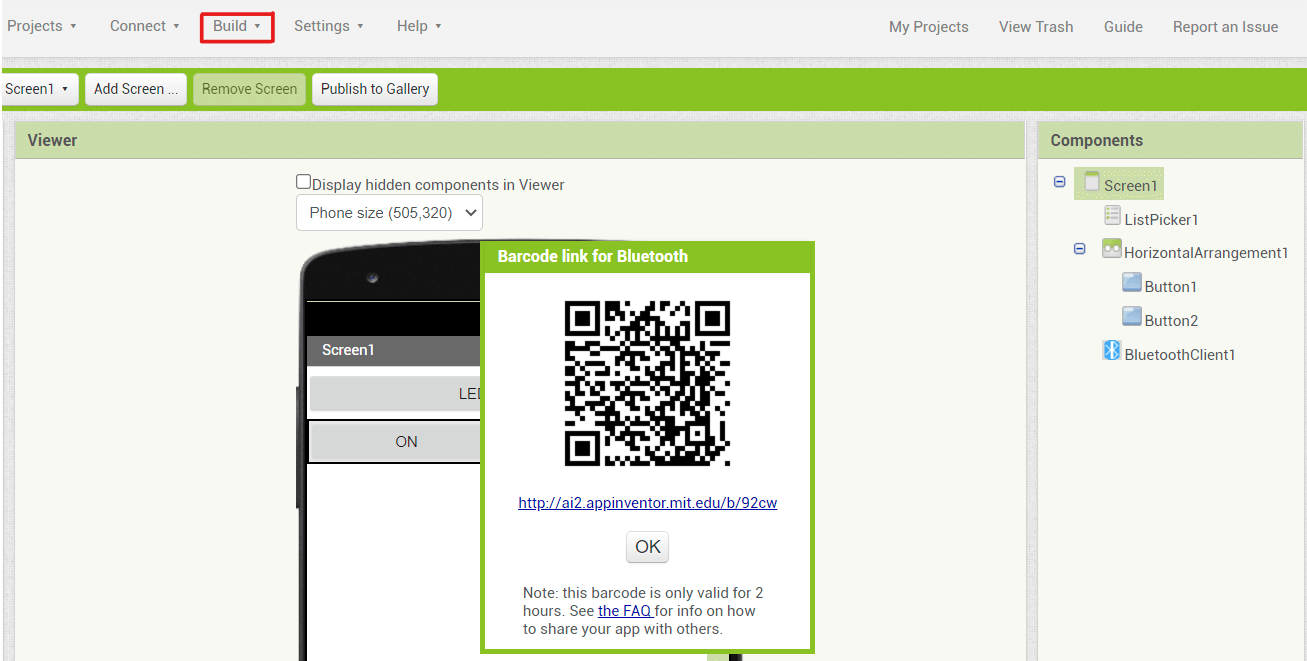
Generating APK⚓︎
Una vez hemos terminado nuestra aplicación, solo tenemos que generar el archivo instalable. Para ello vamos a la barra de menús de la parte superior de la pagina y seleccionamos Build. Aqui nos apareceran dos opciones: compilar y descargar la APK a nuestro ordenador o generar un codigo QR que podemos leer con el movil y que descargará directamente nuestra APK en él. I have chosen the second one because it’s much straight forward.
Final result⚓︎
The App is now installed and running in my phone, which I consider almost a miracle. It has been much easier than I thought it will. I mean, it’s an App I designed! Emotions aside, the result is not functional. The application works and establishes a Bluetooth connection with the module, but when we press the buttons the led on our board does not turn on or off. Possibly it is a code error, or in the serial communication protocols between the BT module and the board. The video below shows the “operation”.
Despite having some communication or code errors, I consider that the MIT App Inventor tool has been a great discovery. Developing a simple and functional interface in such a short period and being able to turn it into an App for the phone is great.
Files⚓︎
- Arduino code file for the ultrasonic sensor(
.ino): file - Processing code file for the circunferences random color test(
.pde): file - Processing code file for the distance bar test(
.pde): file - Processing code file for the field bar test(
.pde): file - Arduino code file for the bluetooth comunication(
.ino): file - Smartphone APK to connect with the bluetooth module(
.apk): file