PD.1. Original idea
The original idea takes as a reference a project I worked on 2 years ago for my Final Degree Project. The idea was to bring and adapt urban rainwater harvesting systems to rural areas where the climate change and conditions did not make profoundly aware to many people who's working lifes are so dependent on that issue.
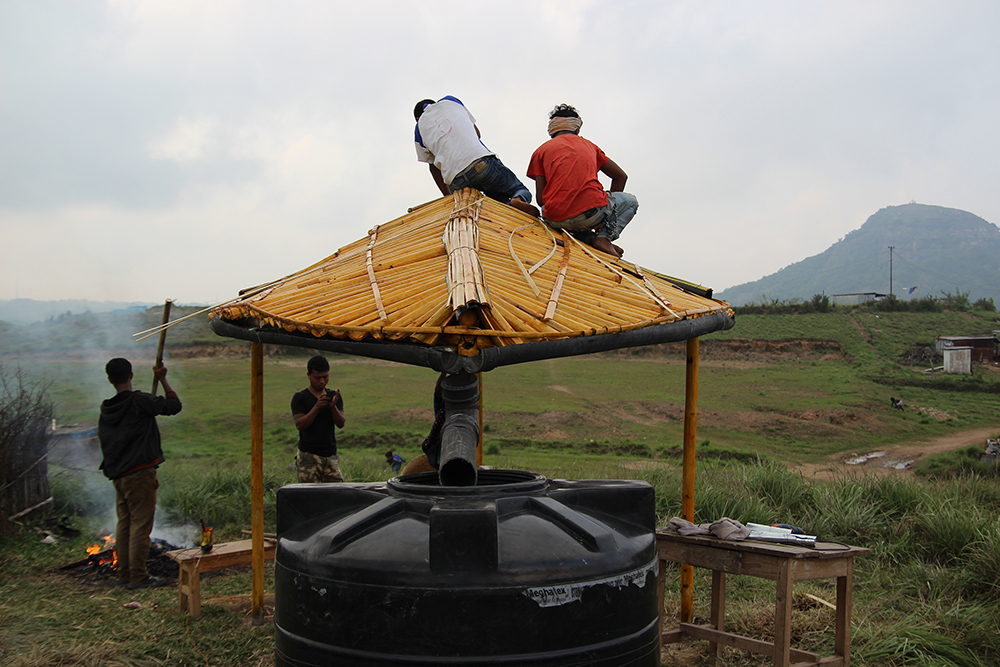
Therefore, with the help of woodworkers in the rainy area of Mawsynram, Meghalaya (India), we ended up building a rainwater harvesting structure made of bamboo for the playgraound of a primary-high school nearby. The idea was to make the people, specially future geneartions to be aware of the importance and potential of understanding environmental and natural issues that affects their daily lifes.
This project just worked as an isolated structure to gather a small quantity of water, empowering its symbolism as a reference of what it meant. Furthermore, deeper environmental systems should be developed for this structural space as a meteo station to become a tool for measuring the data from the environment due to the lack of this kind of data among these rural areas. That is why I for the final project I will focus on designing and producing this device to be easily used as a data receiver and sender.
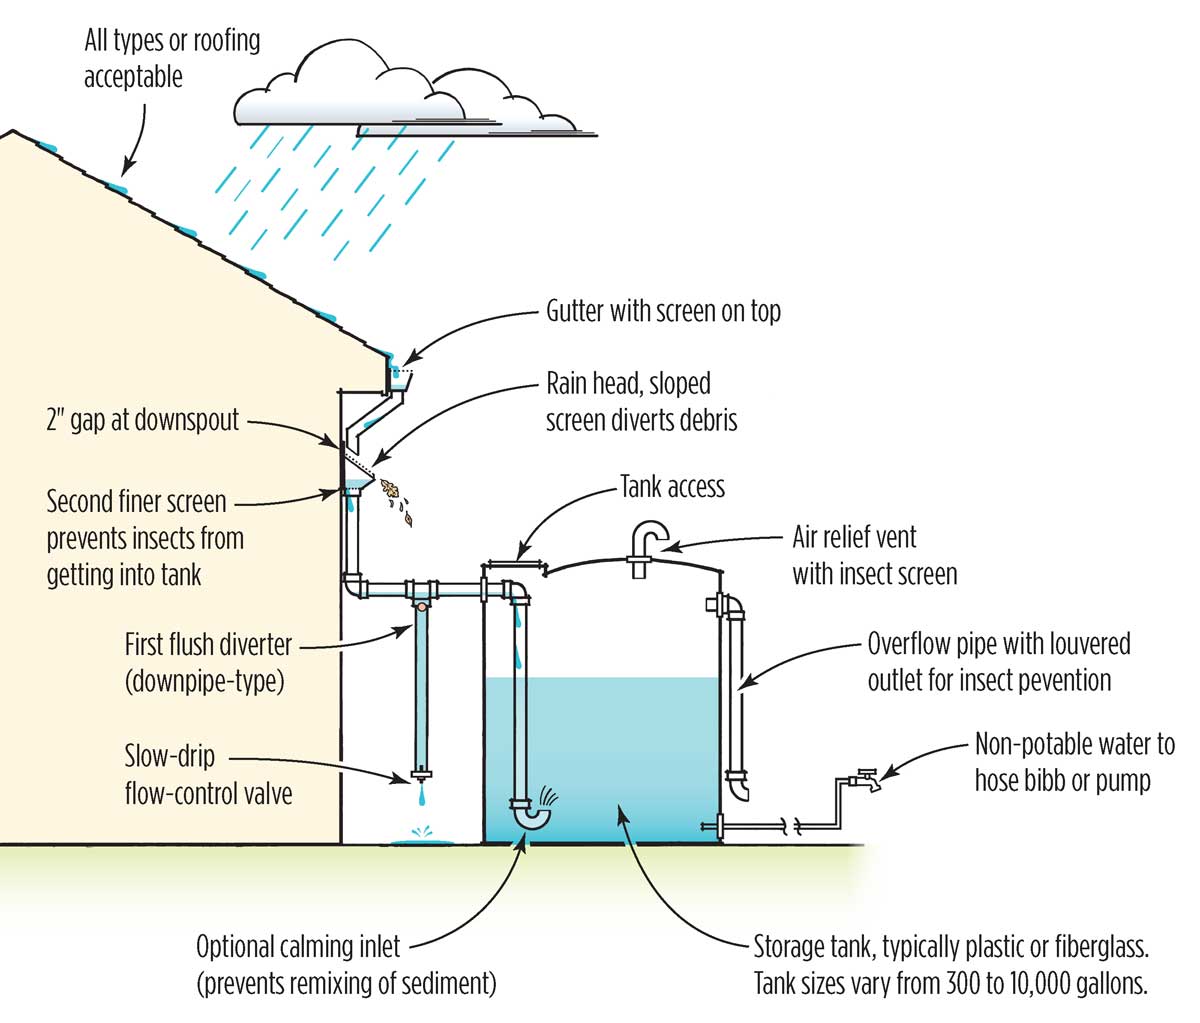
Rainwater Harvesting System
This diagram explains the components and functions of an average rainwater harvesting system.
PD.2. Referents
_WATER HARVESTING STRUCTURES
These examples are structural constructions that work differently several ways for collecting or processing water.
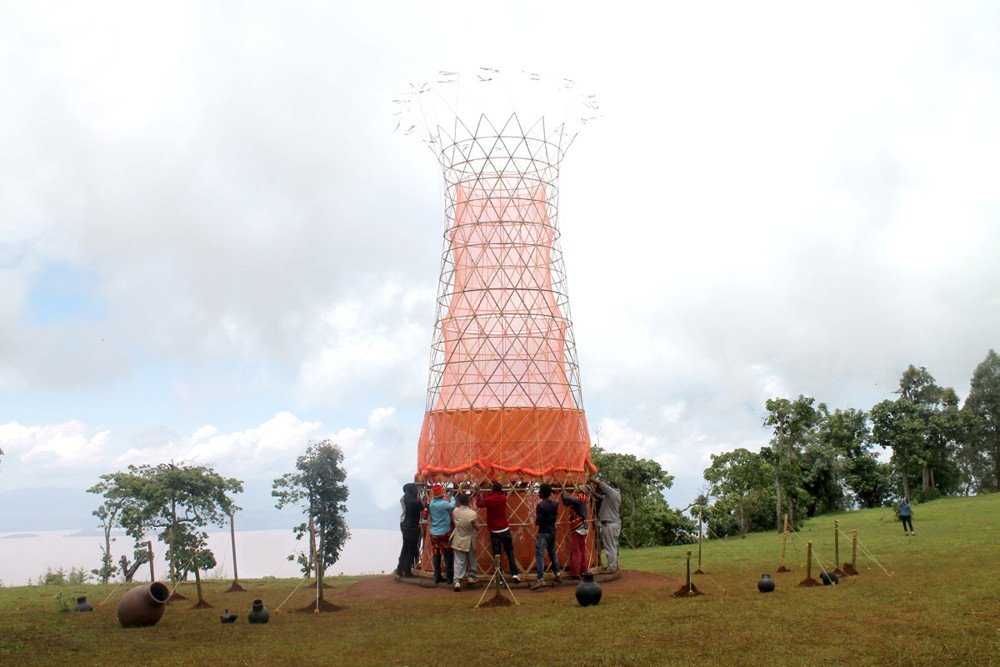
Warka Water in Ethiopia.
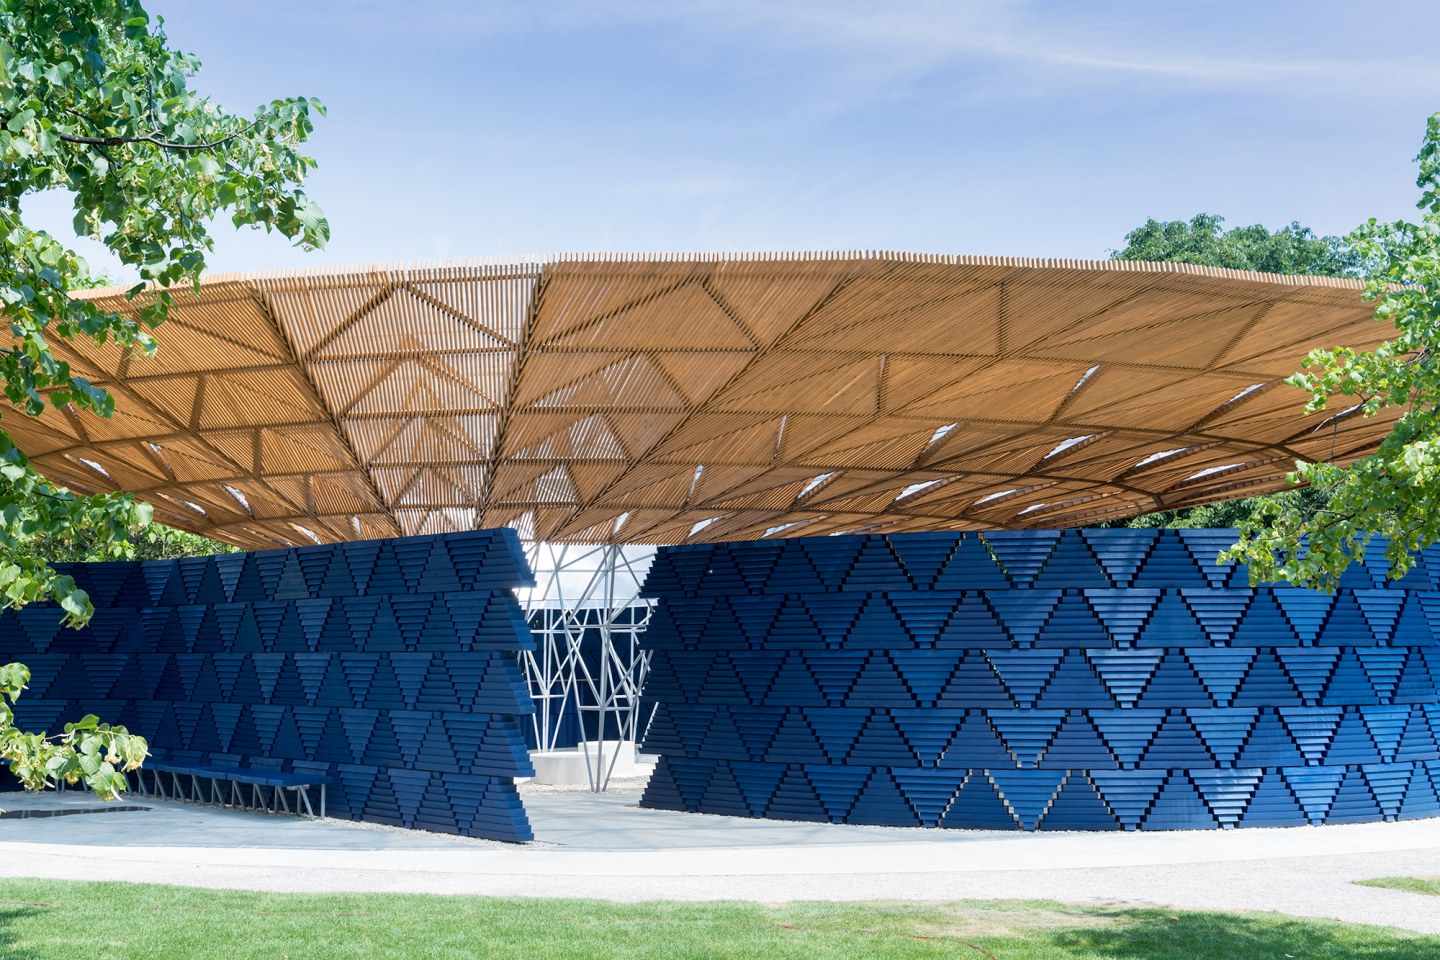
Serpentine Gallery Pavilion by Francis Kere.
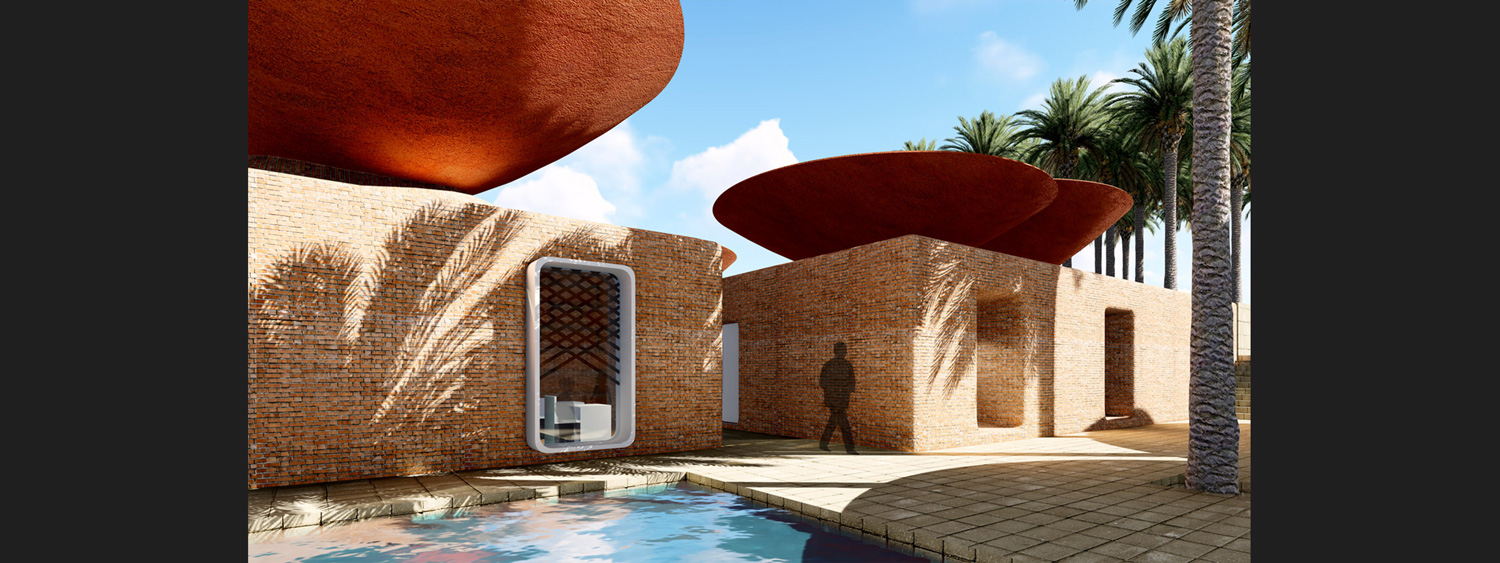
Primary School in Iran, designed by BMDesign Studio.
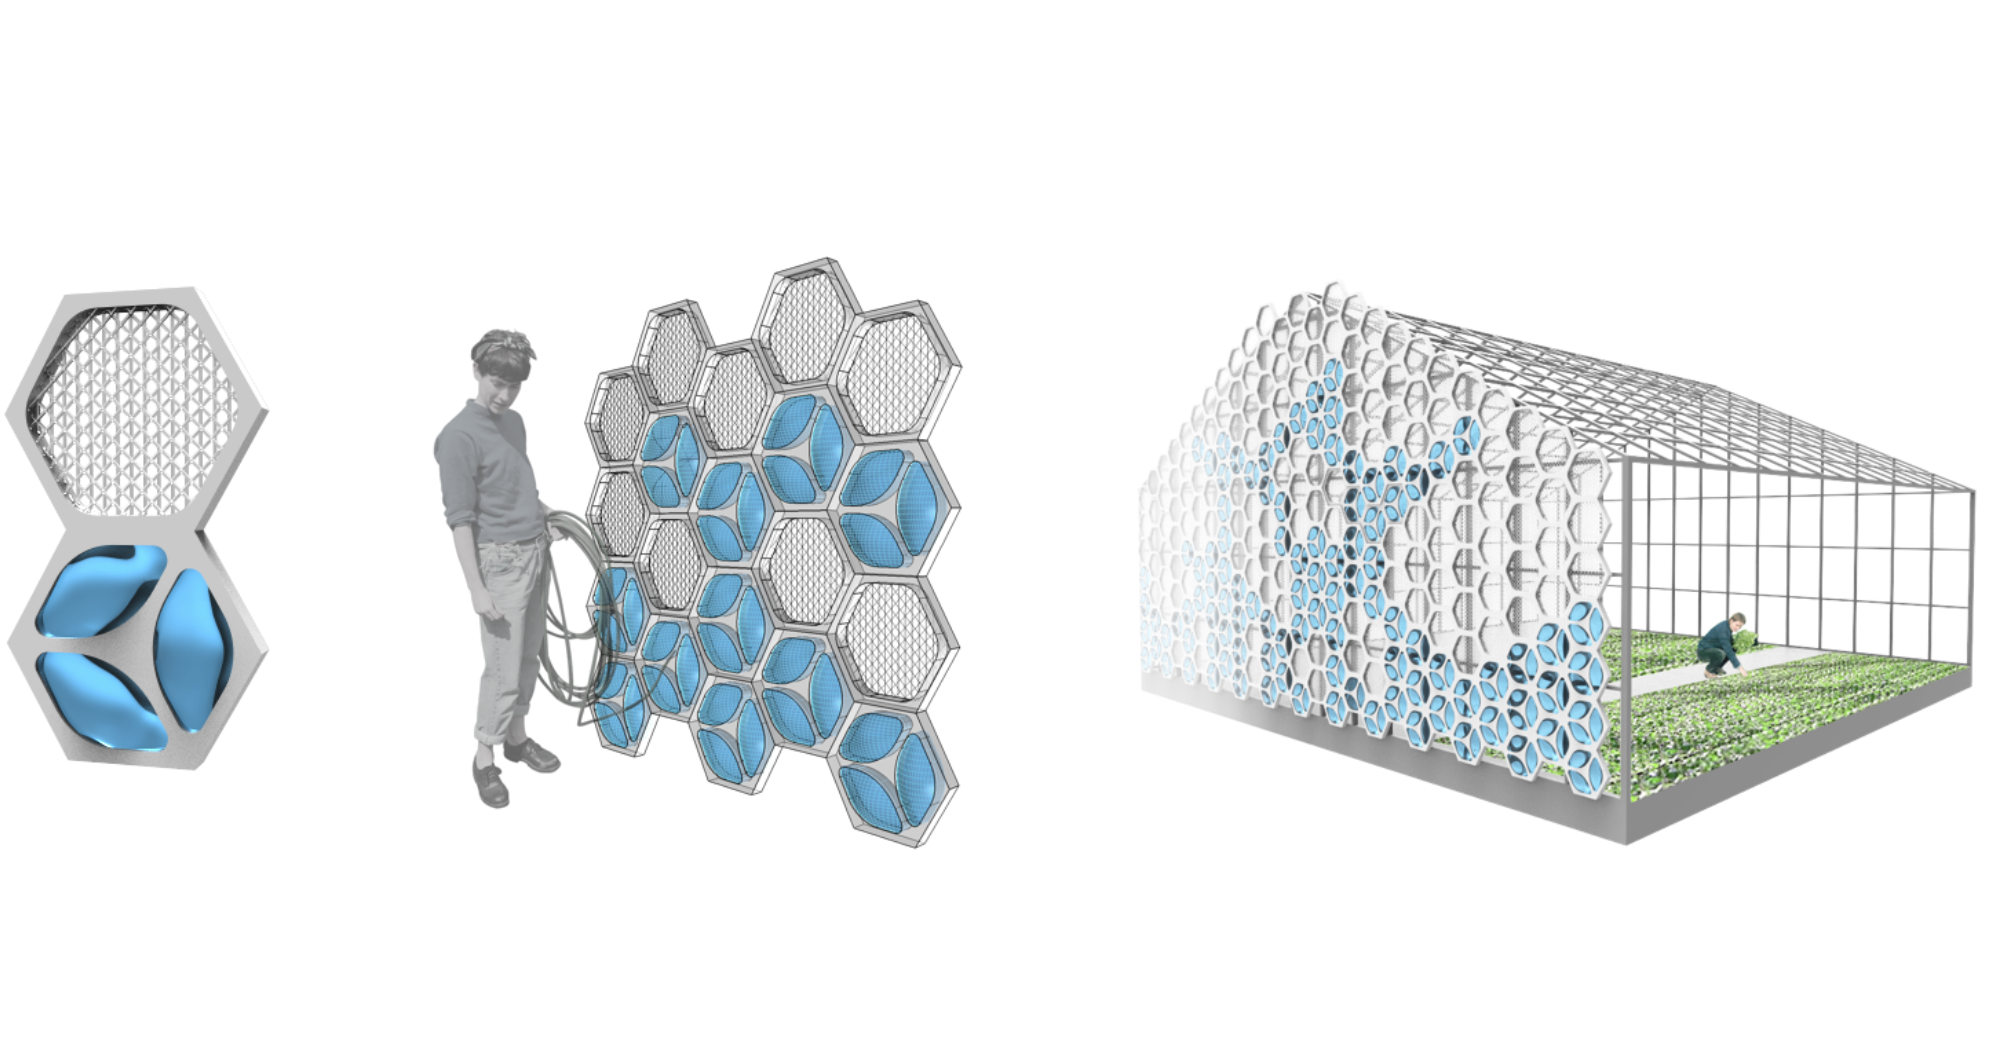
AquaWeb Hydroponic system, designed by Nexloop.
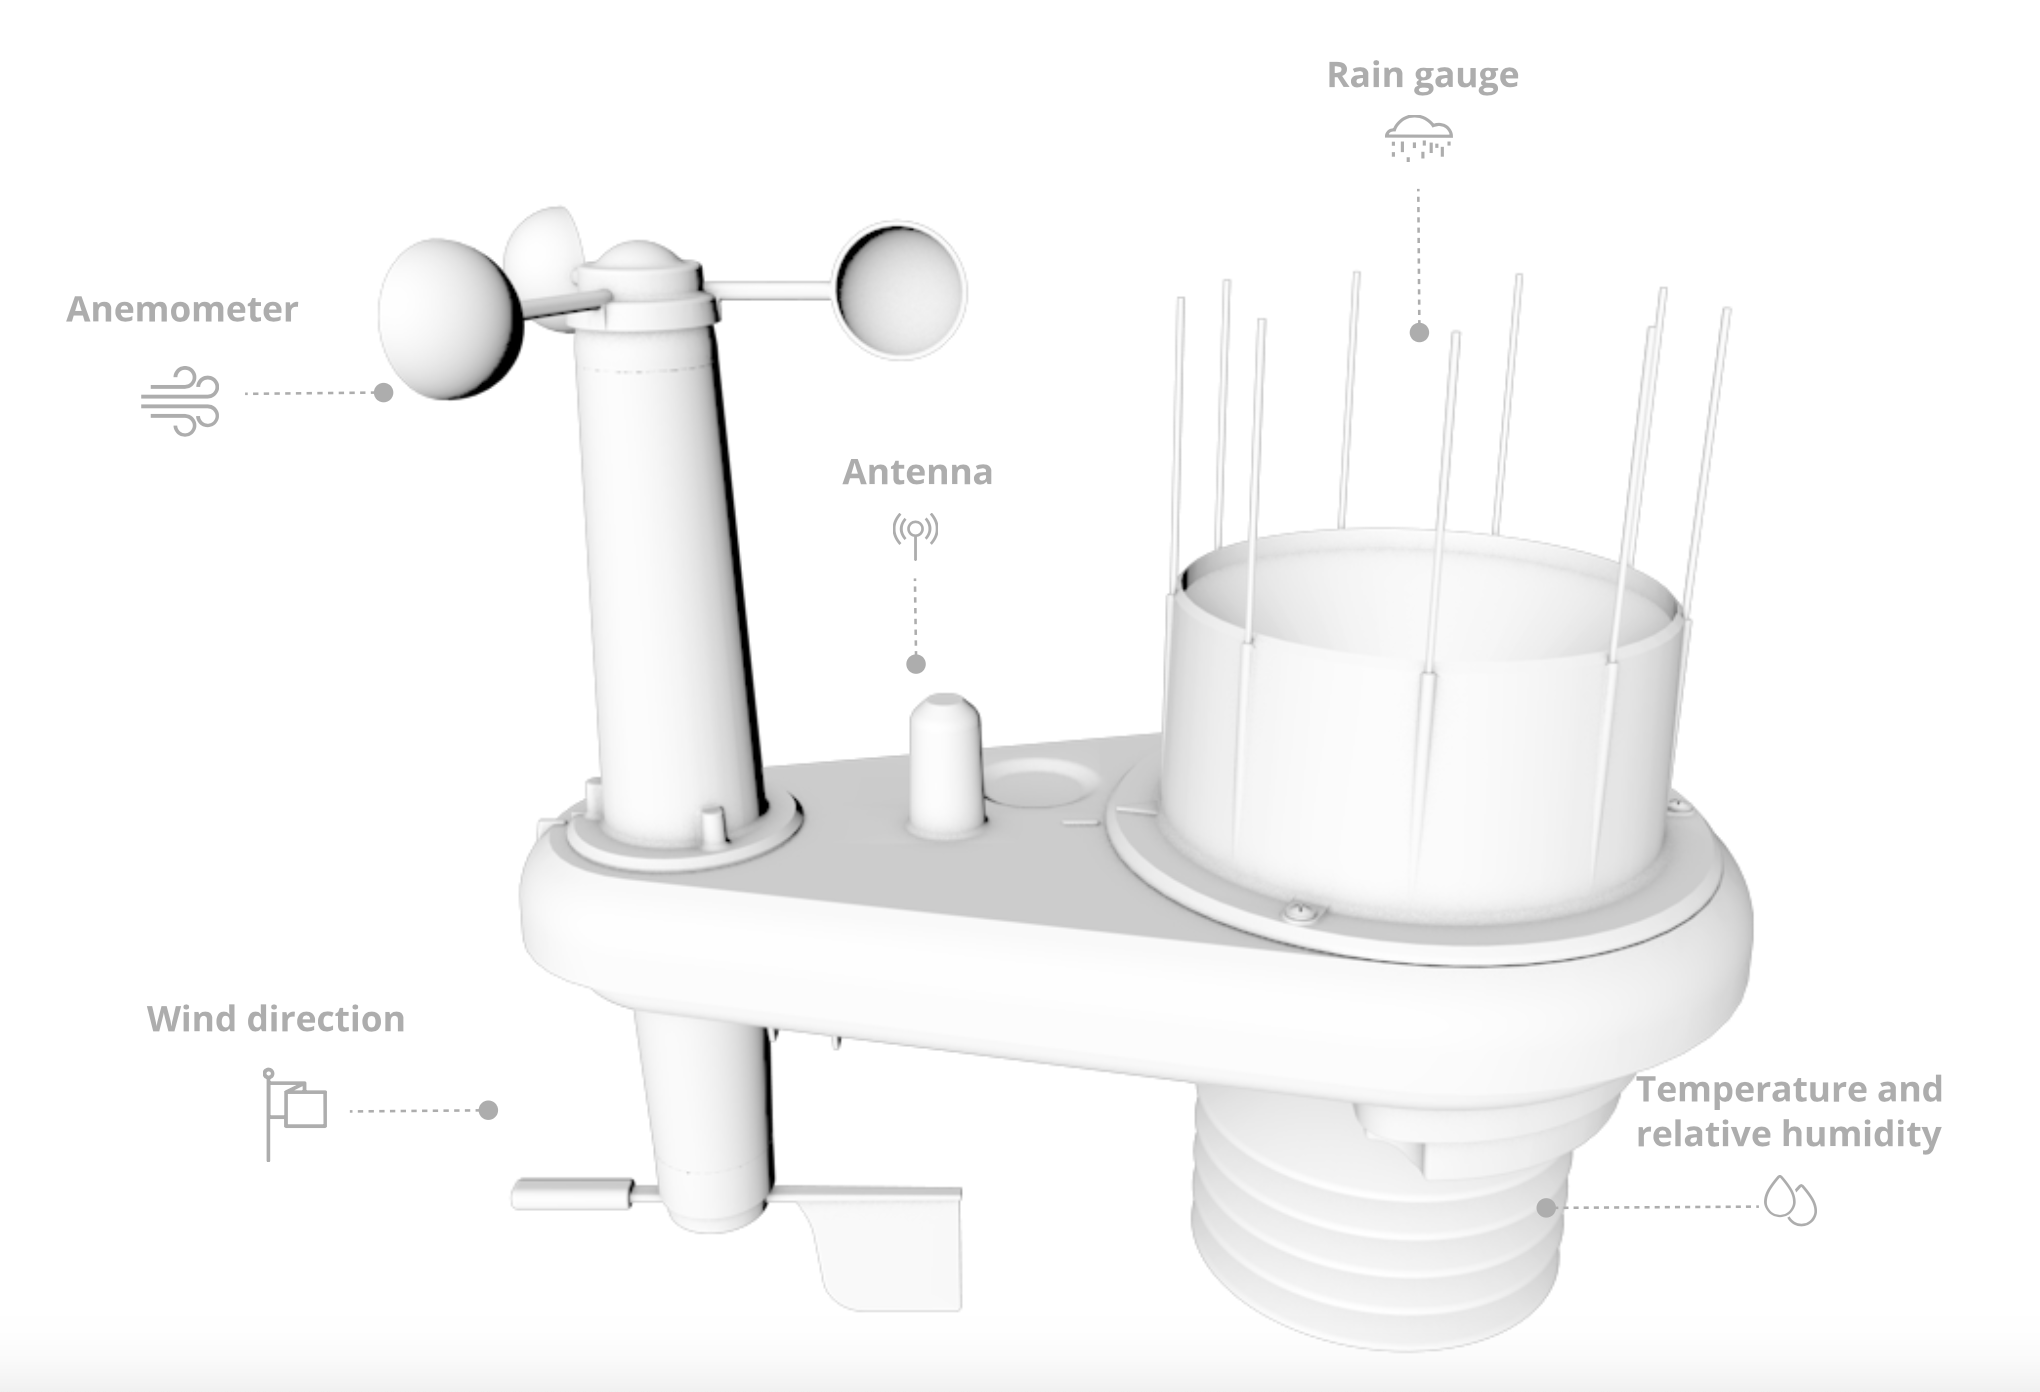
_WEATHER STATIONS
There are two interesting projects that I took as referents in terms of the concept of the system, as well as the mechanical and software components they used.
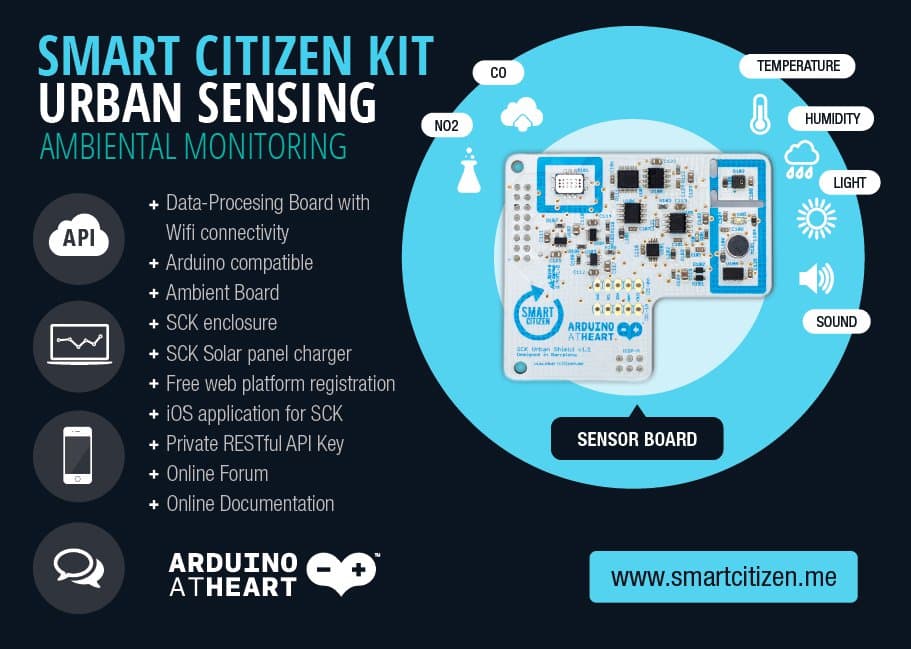
SMART CITIZEN
The first one is Smart Citizen. A project that was developed in Barcelona FabLab:
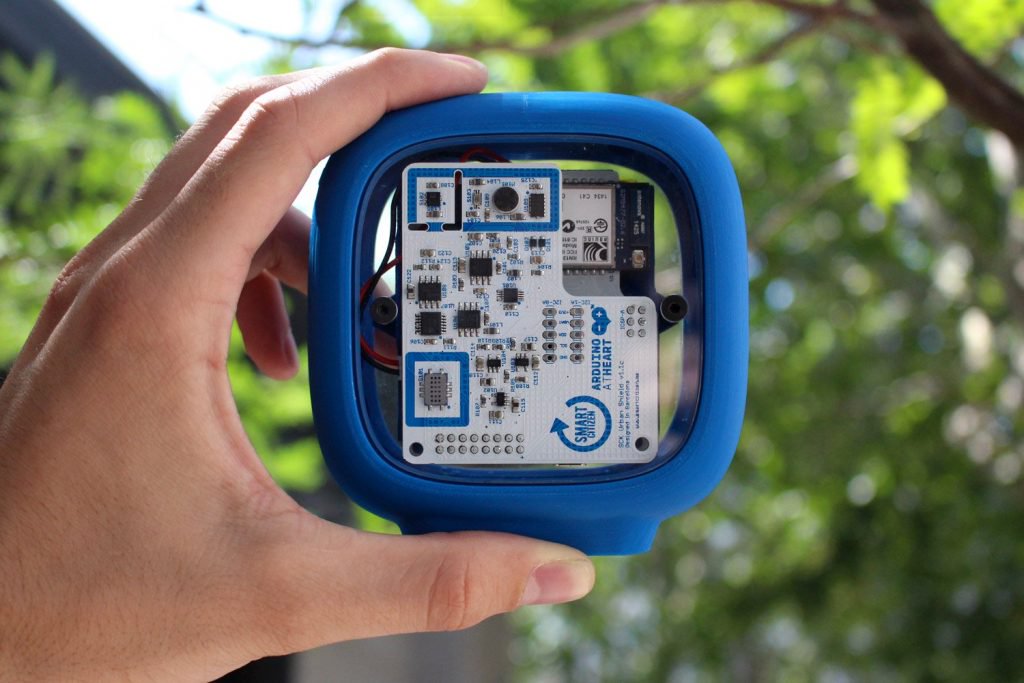
This device is used to capture, analyze and share data from urban environments within an open source development community. The technology used is based on arduino and the information is available to public on their own Smart Citizen platform.
The different sensors included on the device can be seen on the picture below.
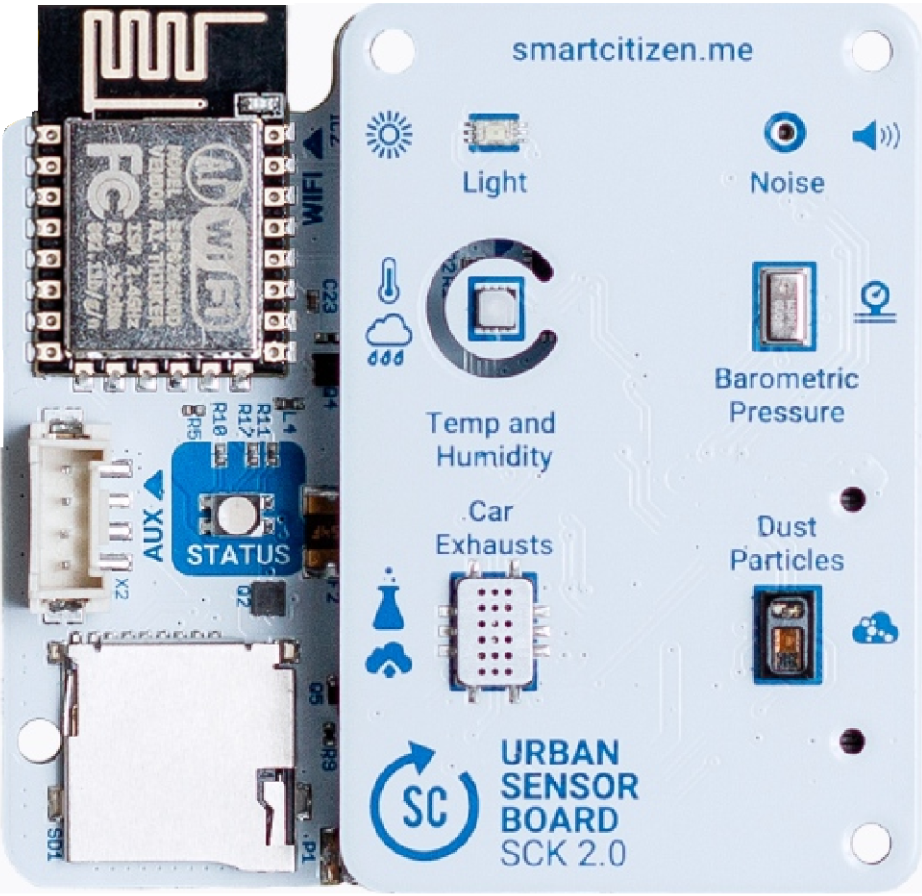
The main difference between the concept of my project and the one from Smart Citizen, is the context of use that defines the system. The Smart Citizen device is set mainly for urban areas that need to detect not just pollution but also noise rates; whereas my system is focused on rural areas, specially the ones facing windy and rainy conditions. That is why the sensor gauges as well as the production process will surely change.
PLUVI.ON
The second referent I found useful for my project is another open source project from Brazil called Pluvi.on.
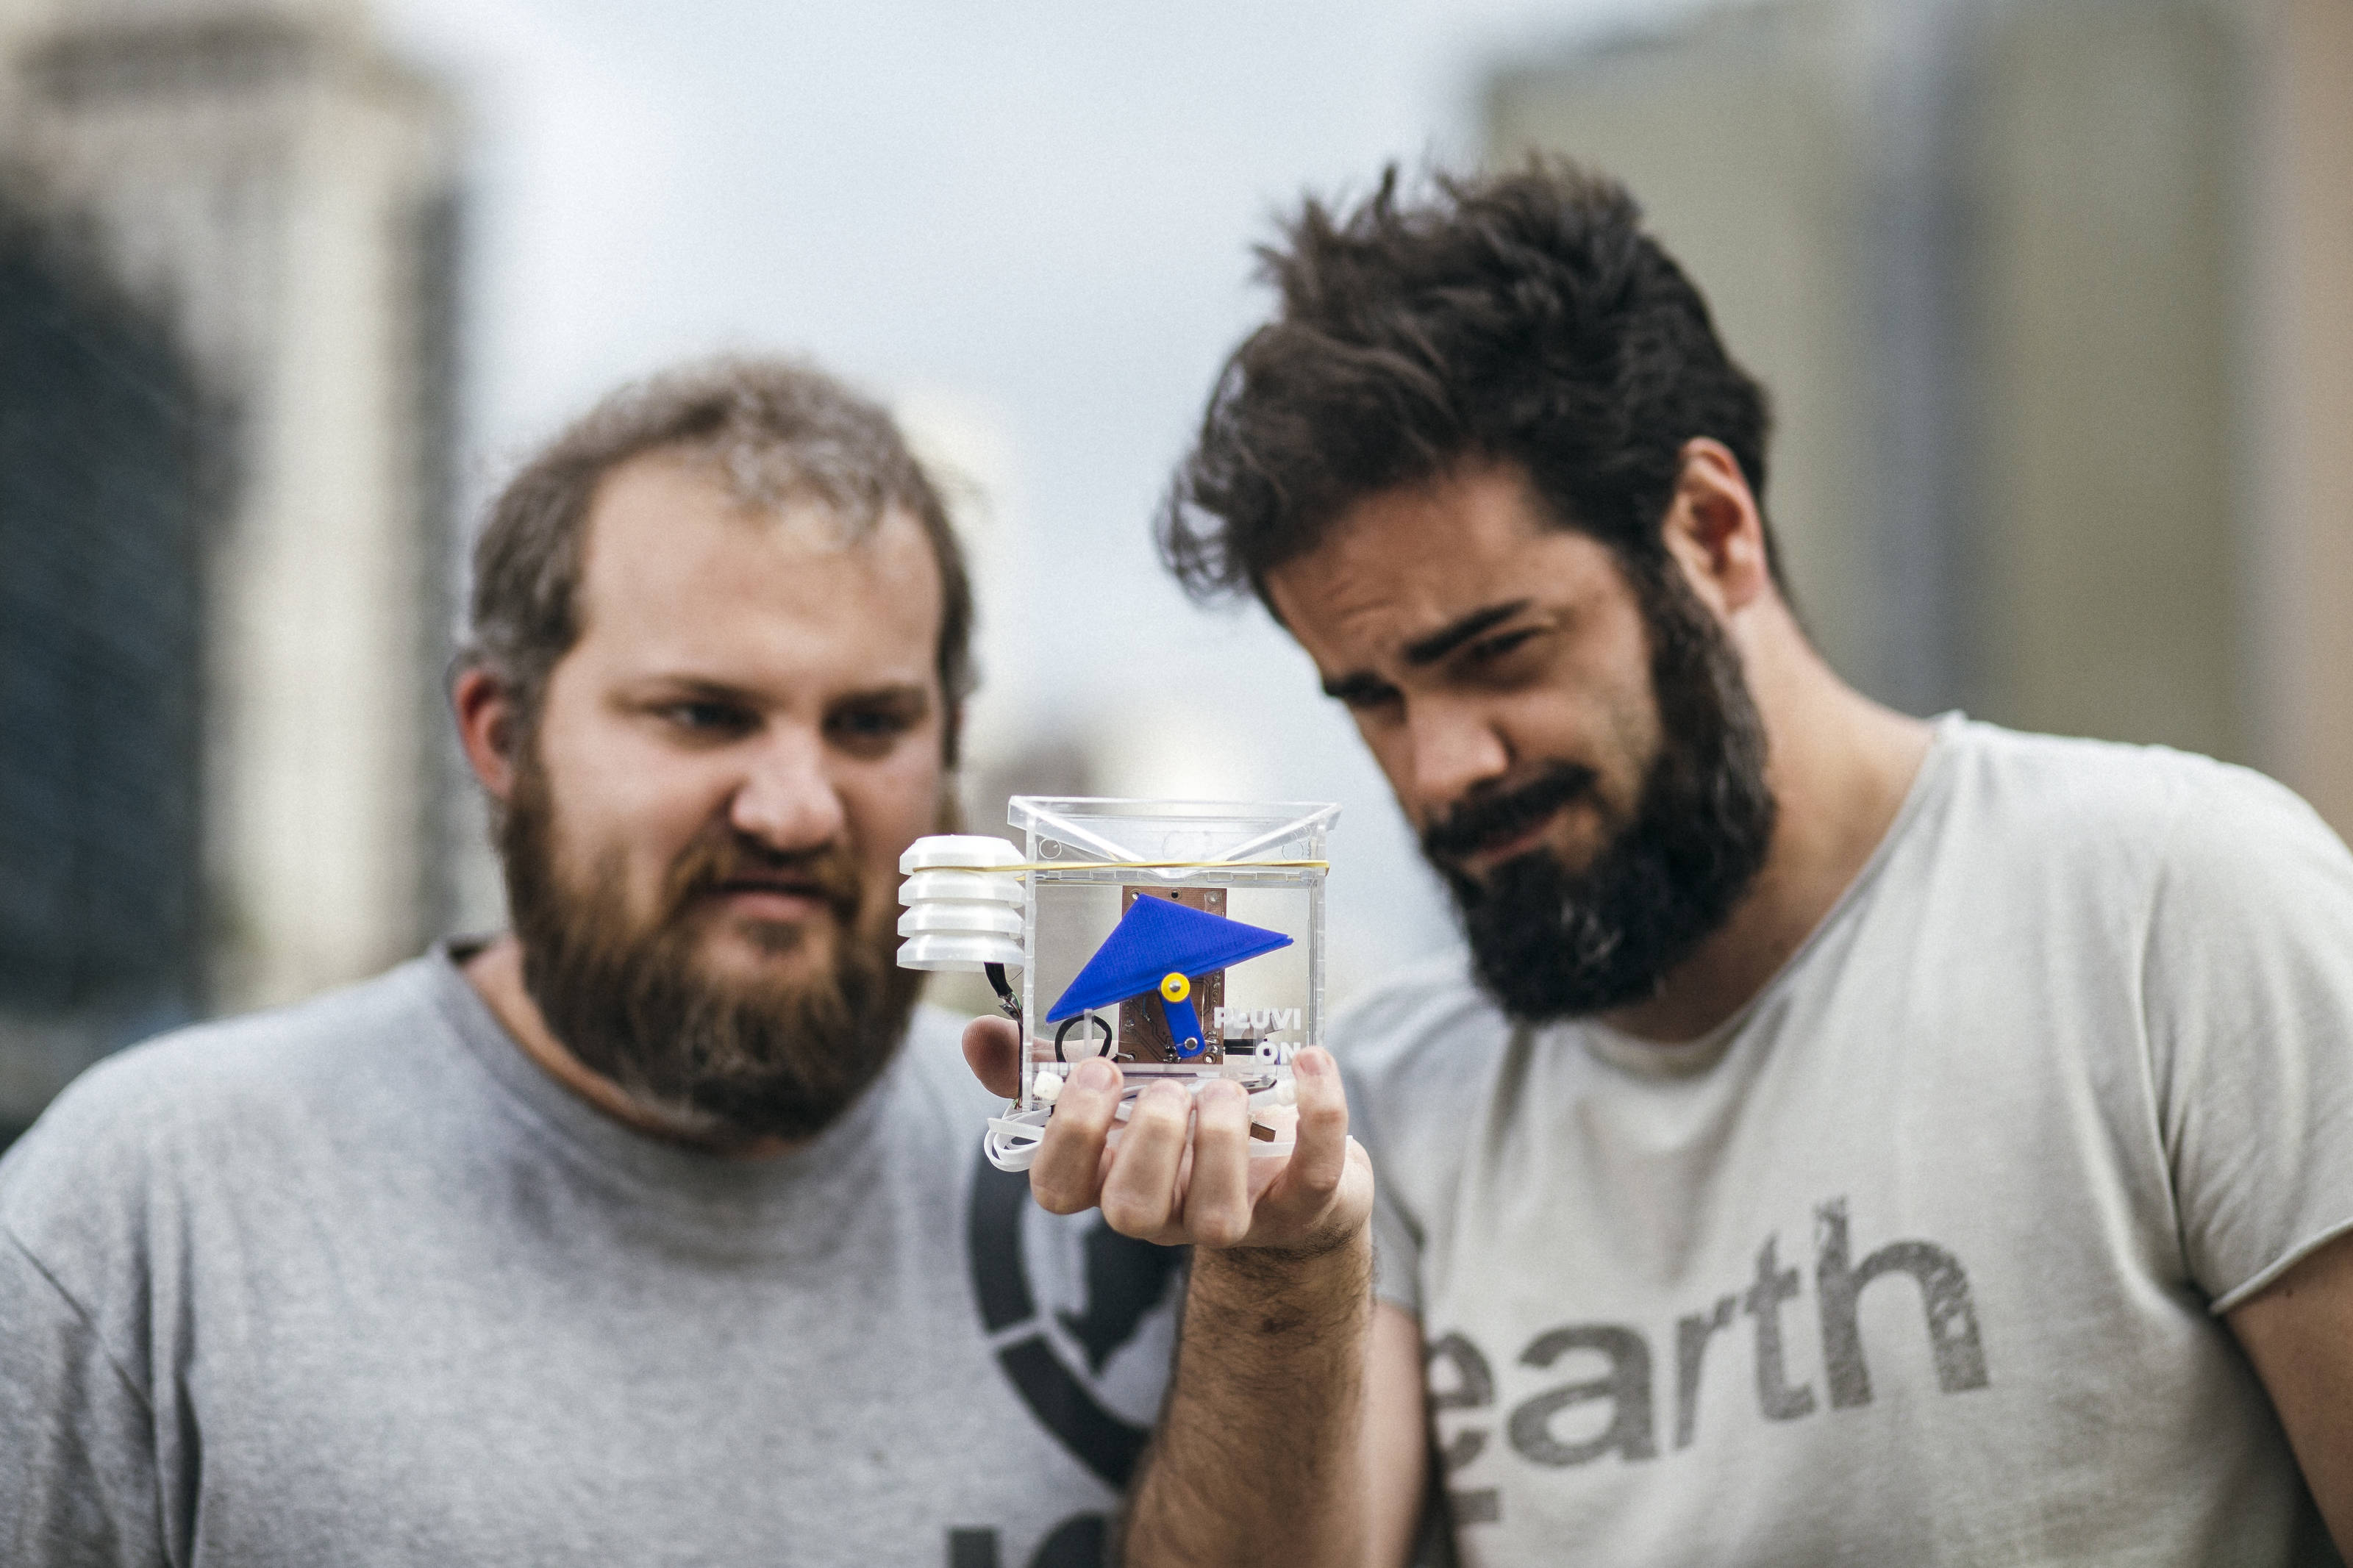
This system is similar to the Smart Citizen project as a climate monitoring system, but the production focus is meant to be projected widespread and adaptable to new redesigns and new open source systems.
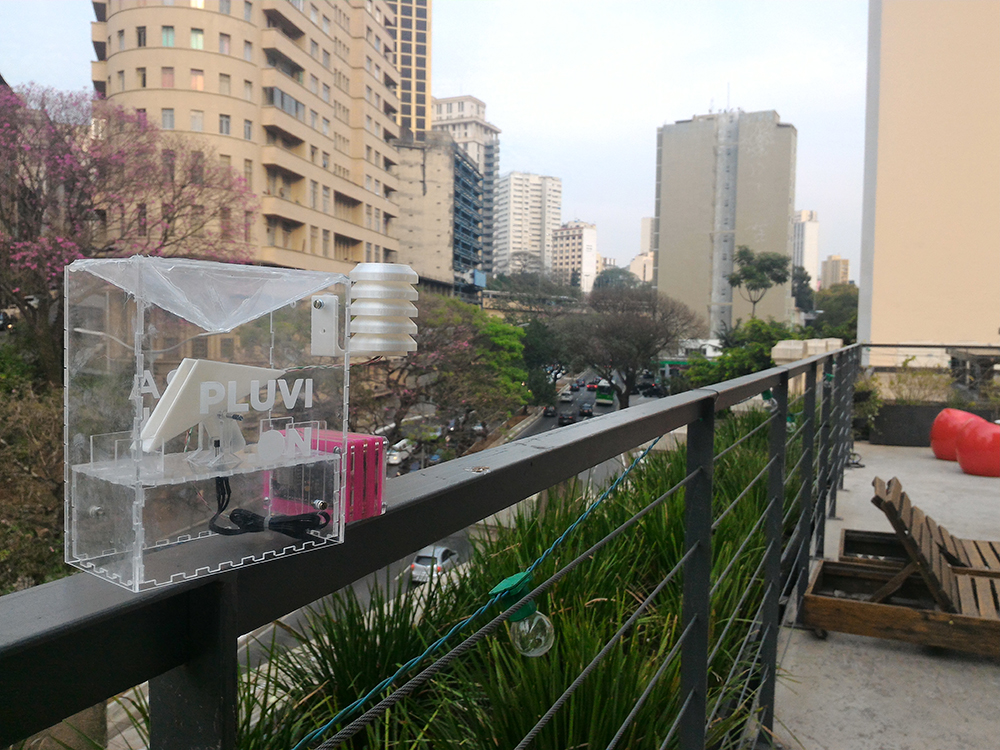
The original device has similar climate measurement tools that I need such as the wind gauge and the rain gauge. On the following image, we can see the new redesign of the device, more compact and reliably produced.
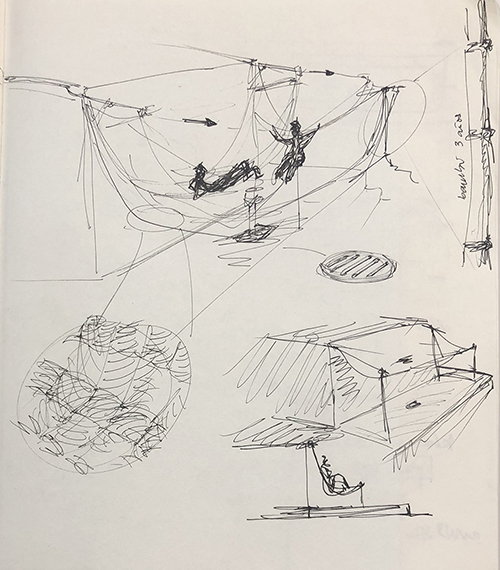
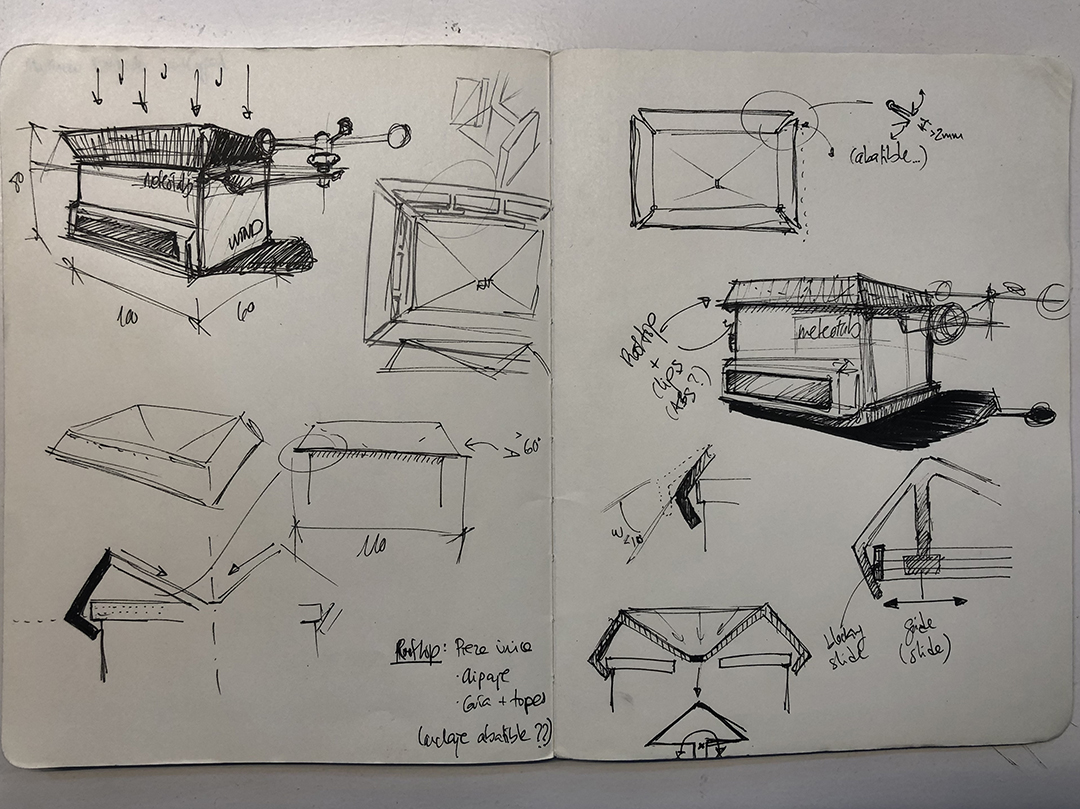
PD.3. First ideas
Rough ideas
These are some ideas I came up with to adapt the system for different cases.
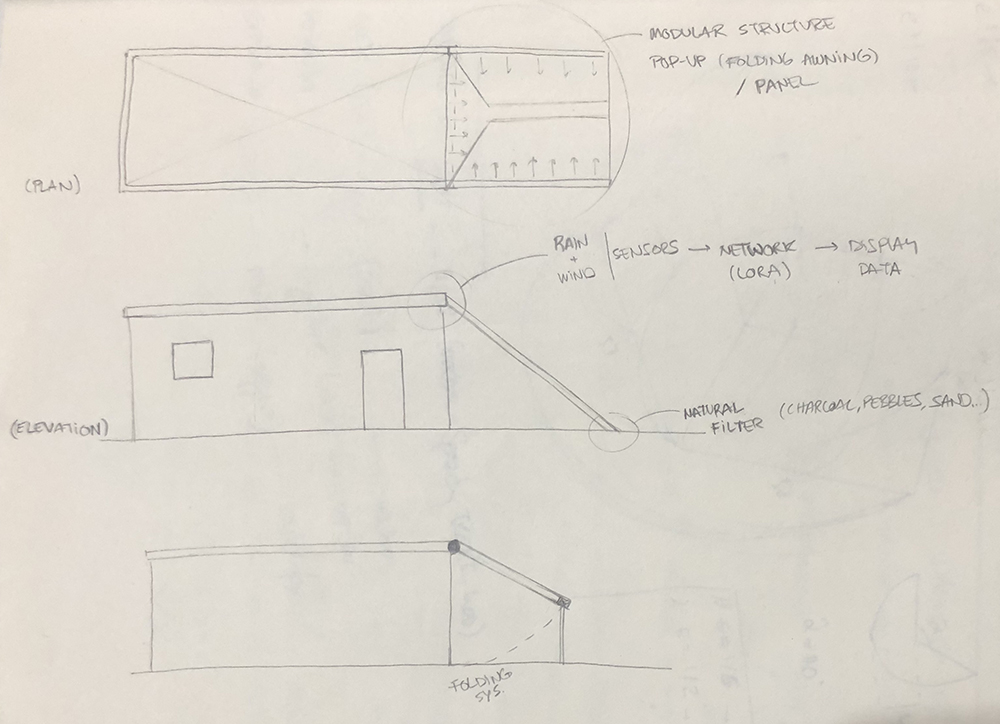
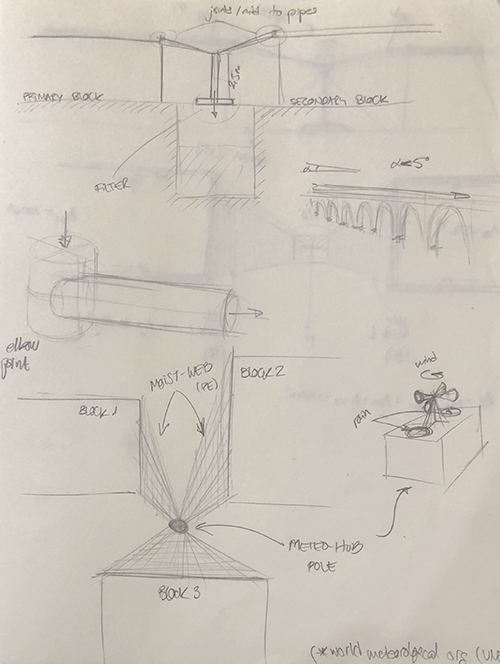
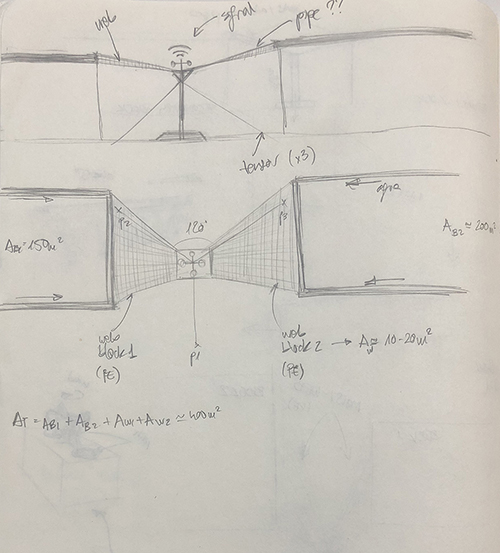
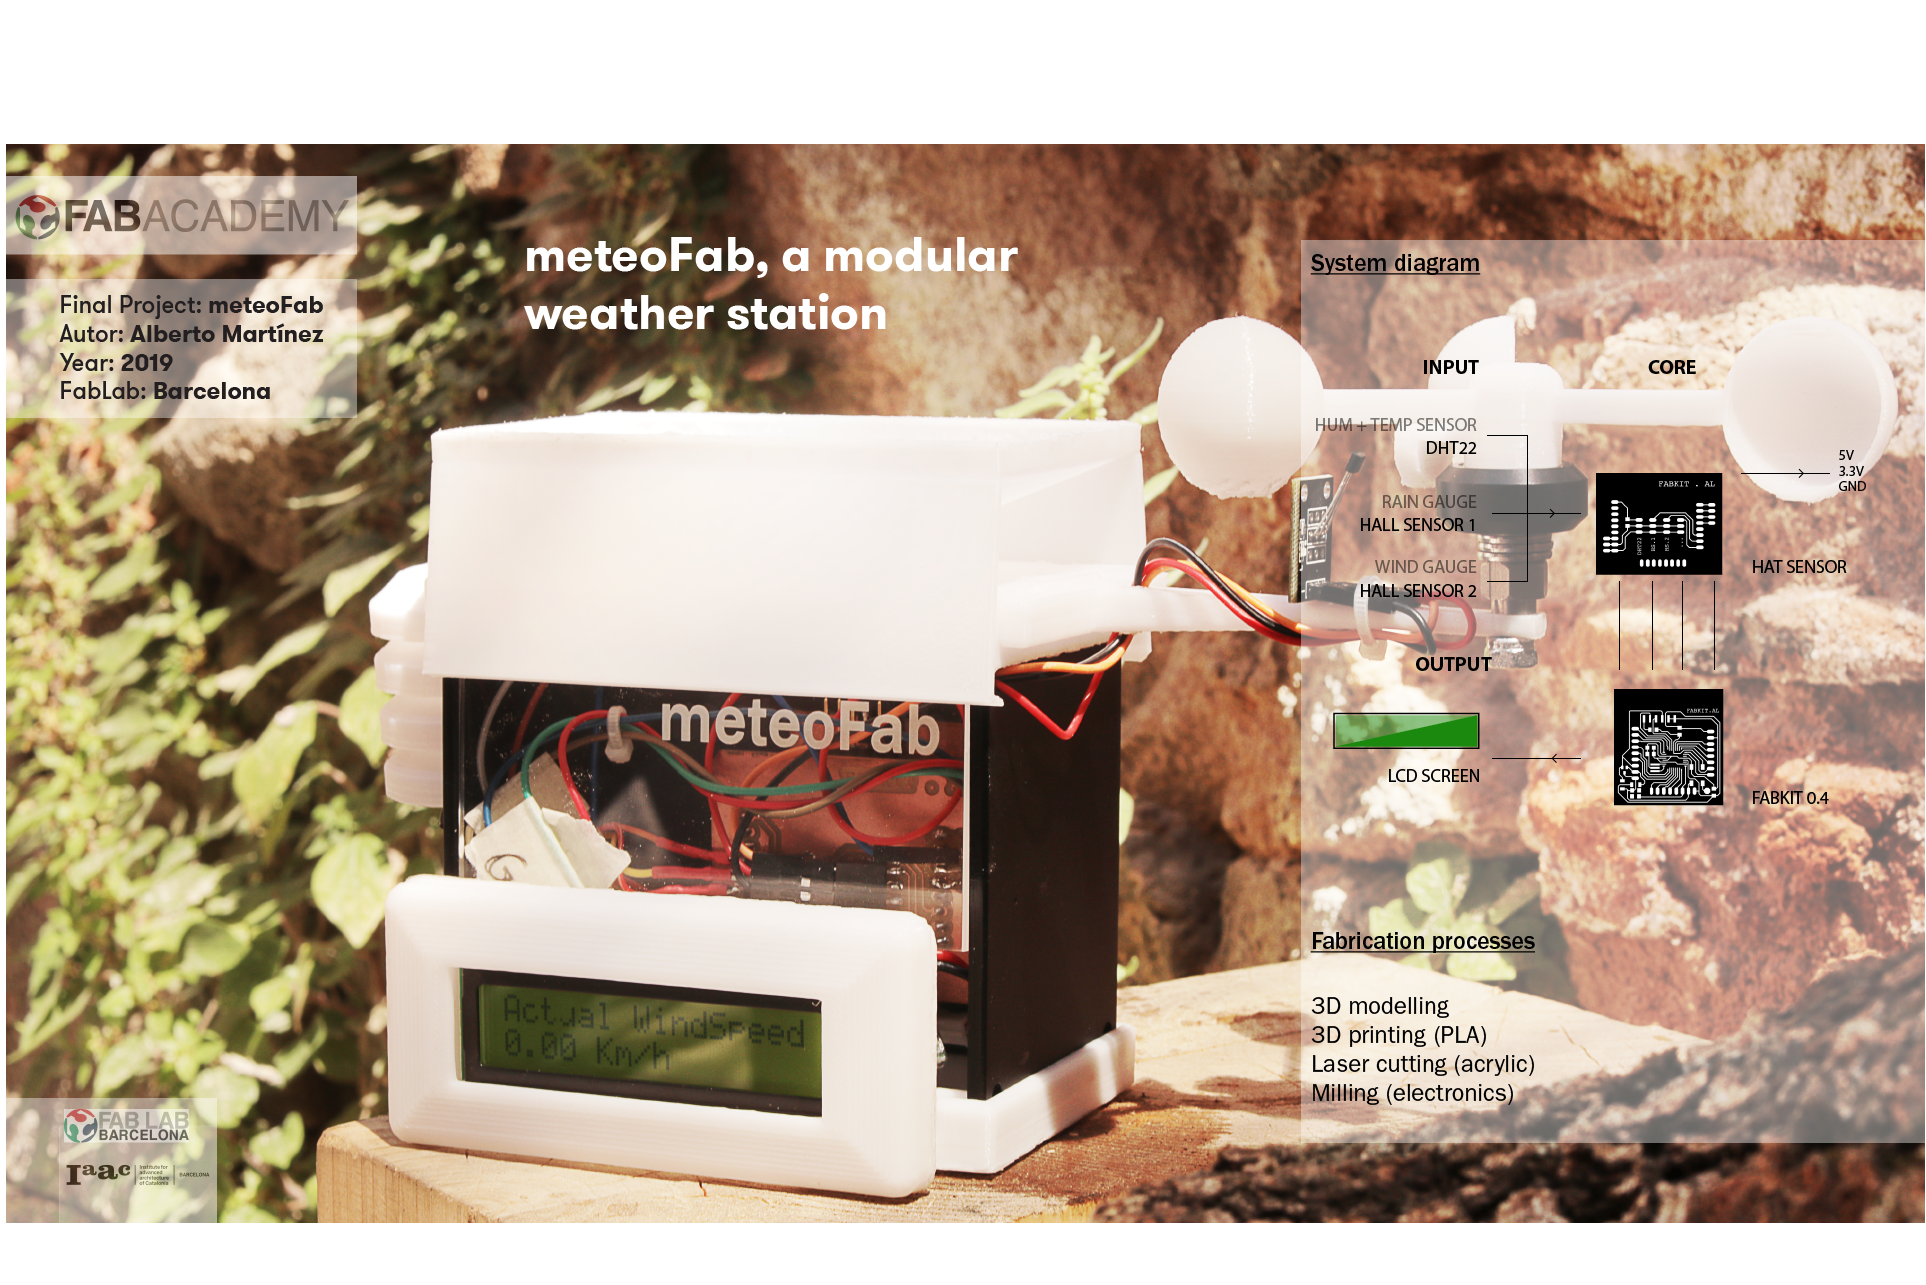
System diagram
The system may include a wind + rainwater data base on top of a pole, fixed to the ground by steel cable tensors. The data obtained by the system should be sent by Lora network to local devices to read and store the info.

On the second level, there'll be a natural filter that will clean the water coming from the rooftop and the moist collected by a PE net direct from the rooftop as well. All the water collected in the system will flow down the pole, so that it can be conserved in plastic water tanks for domestic use.
Materials
The list of materials used for this project should be accesible and suitable for many situations. As the reference project was held in a rural and rainy area, where there was poor access to many affordable goods and tools for fabricating or reparing any mechanism, the idea of the project is to take advantage of the natural and waste material resources to create their own systems. For structural constructions, any work material such as bamboo canes, metal tins and plastic nets or covers, should be implemented on the design of the system.
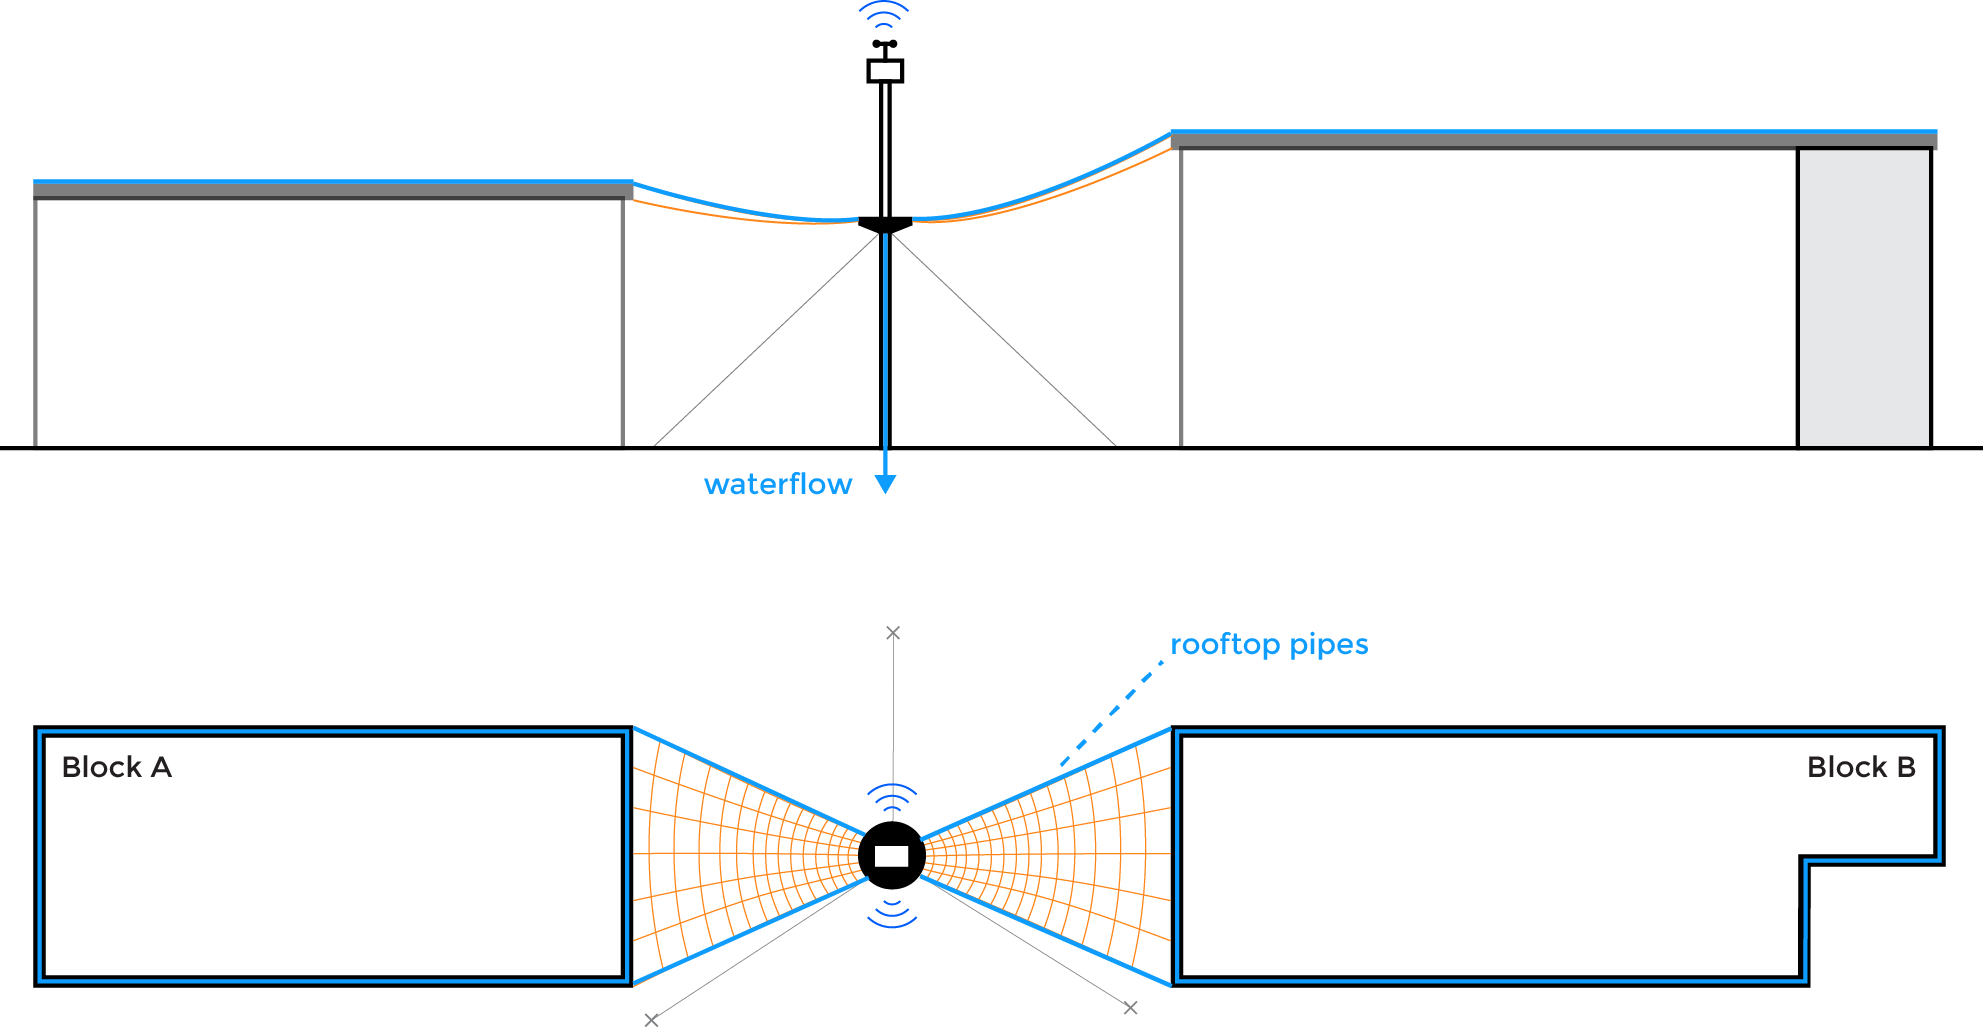
Bamboo's natural conditions make it an interesting material to use as a pole.
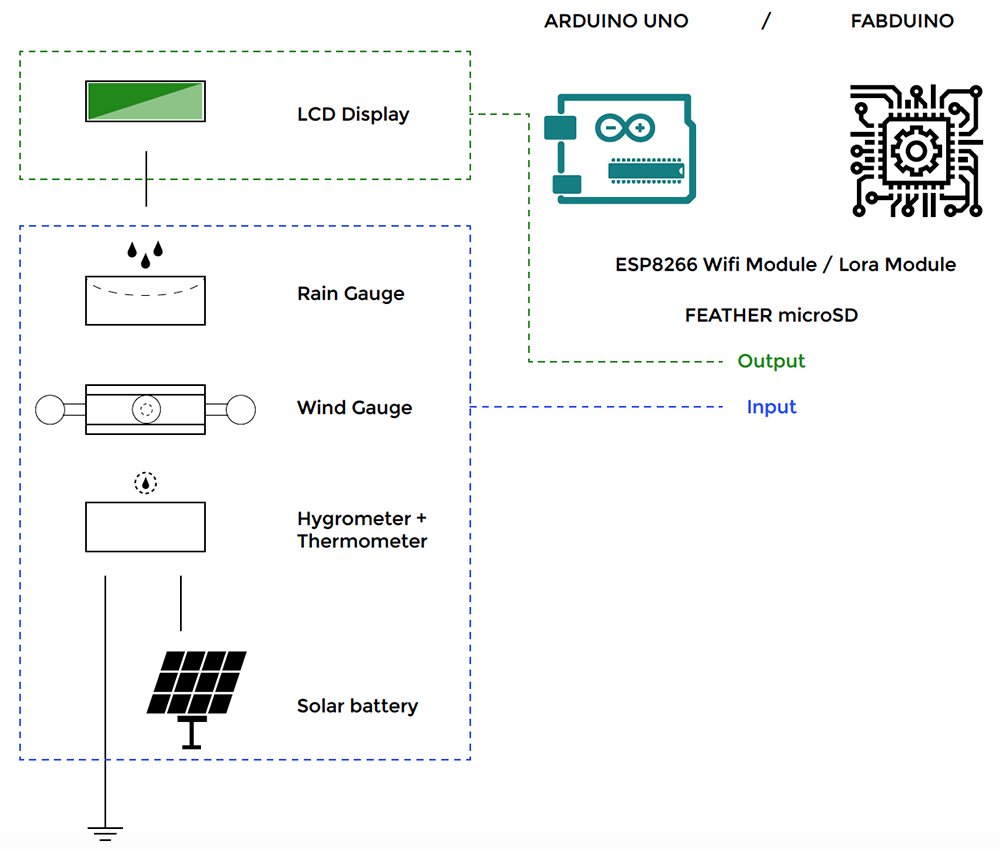
On one side I will design all the electronic board I may need, similar to the Fabduino board, with an ATMega328p microcontroller, and modular shield boards for the sensors: DHT22 (temperature and humidity), the wind gauge system components (DC motor vs magnet + hall sensor), rain gauge; and also I2C for LCD display, miniSD card, and ESP8266 wifi module.
I will also design the container that will enclose all the components. This case should be made of recycled materials such as plastic bottles and trash.
Furthermore, all the sensor gauge hardware elements for the anemometer and the pluviometer, should also be produced and even any extra gadget that may add an extra value to the system and make it adjustable to different positions.
I may also need all the materials required for most electronics production, such as pcb board, electronic components, shields, programmers, sensors, etc. For the rest of the system, I chose:
Here there are some references I took that could be part of the source of my materials:
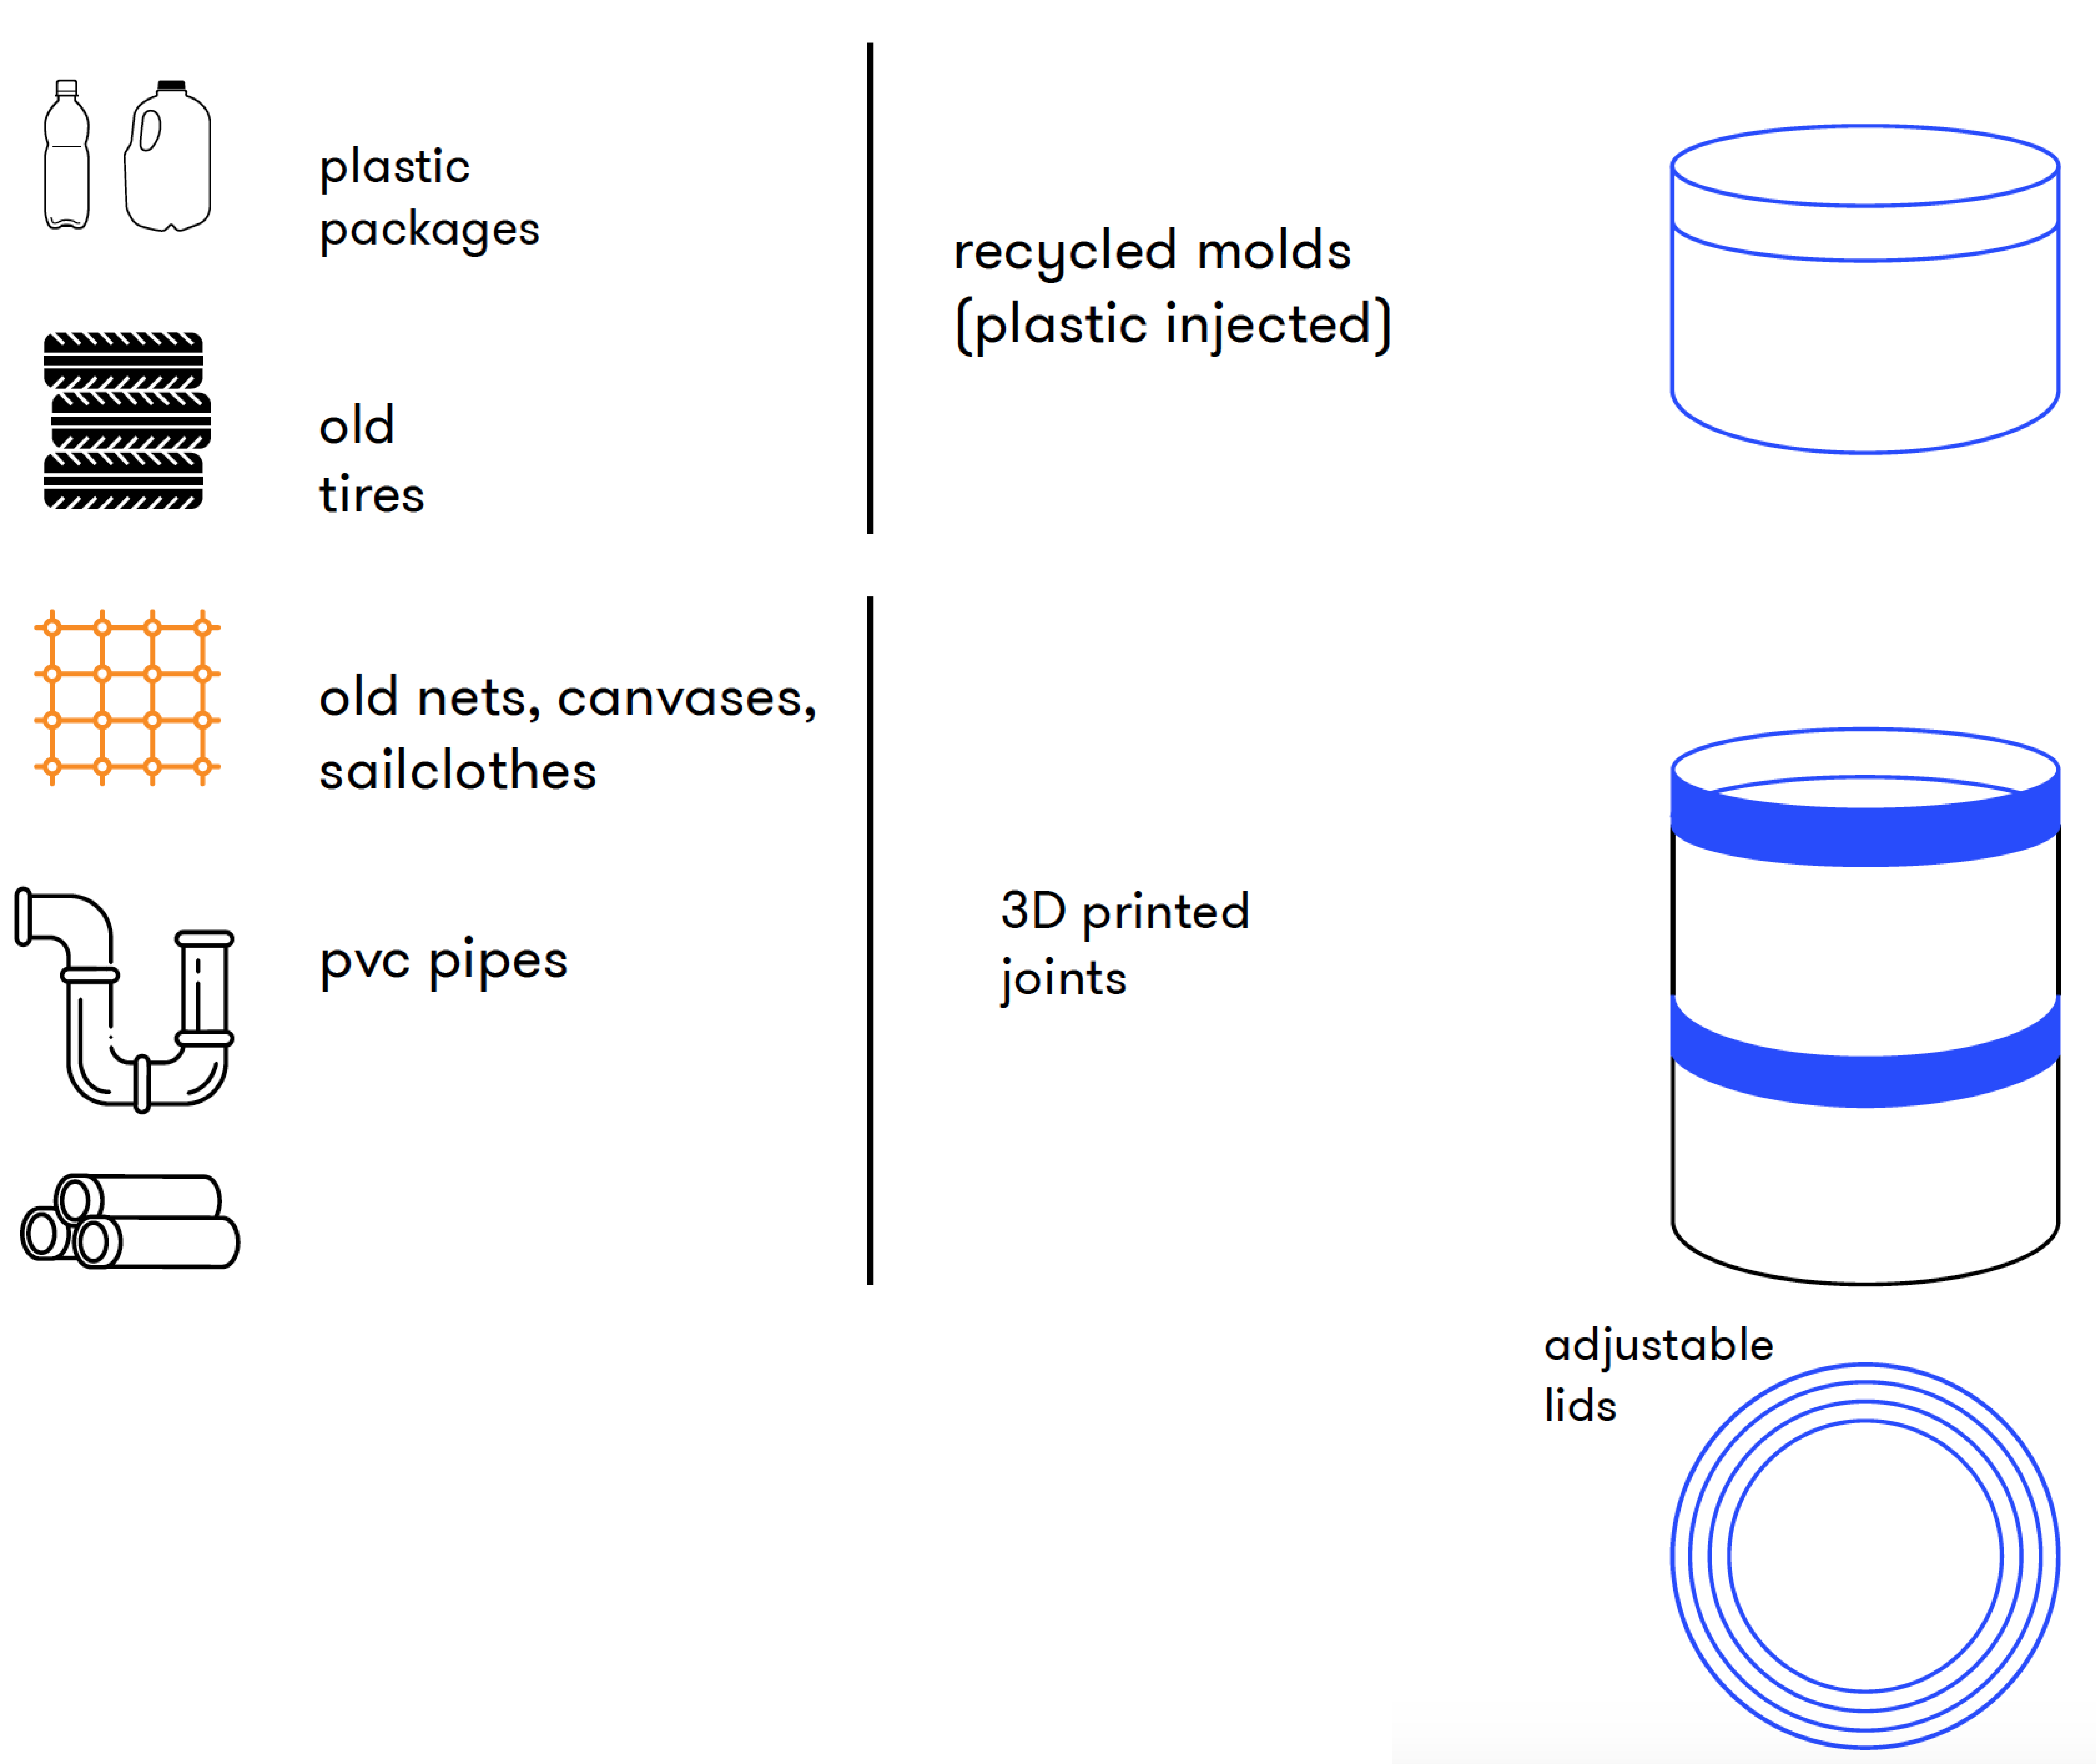
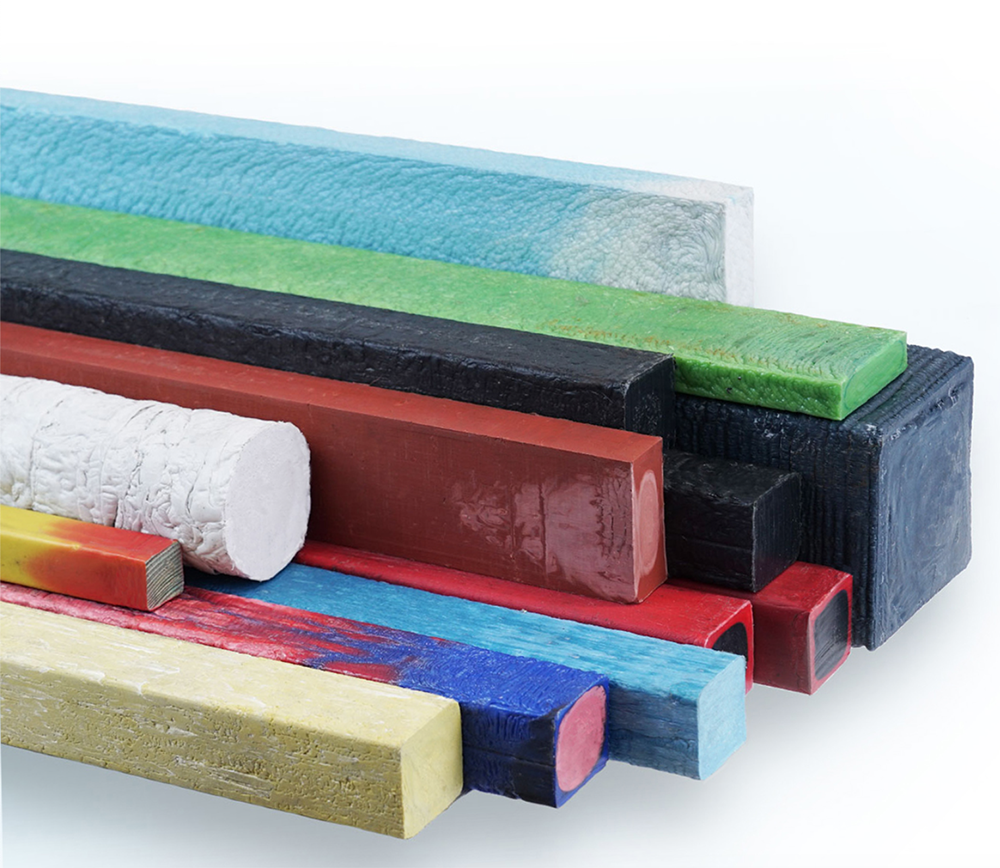
- Precious plastic
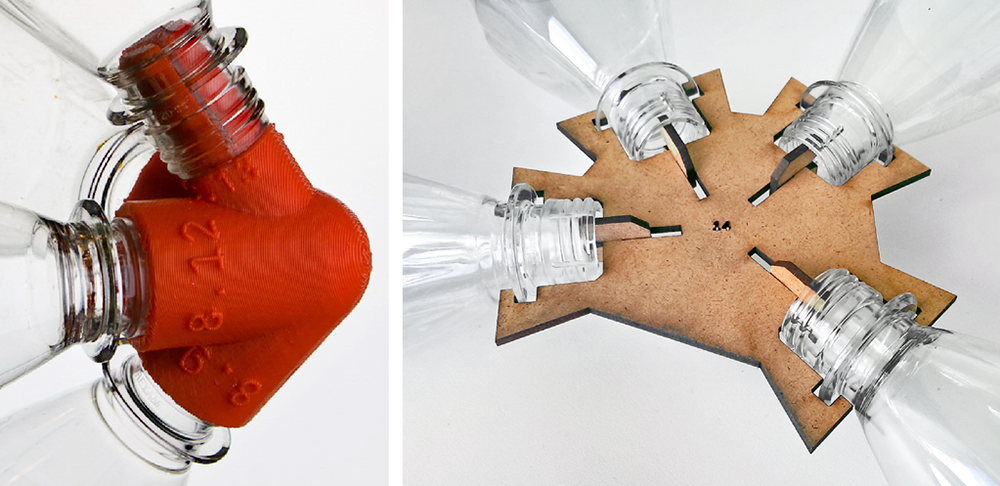
- TrussFab from Hasso-Platte-Institut
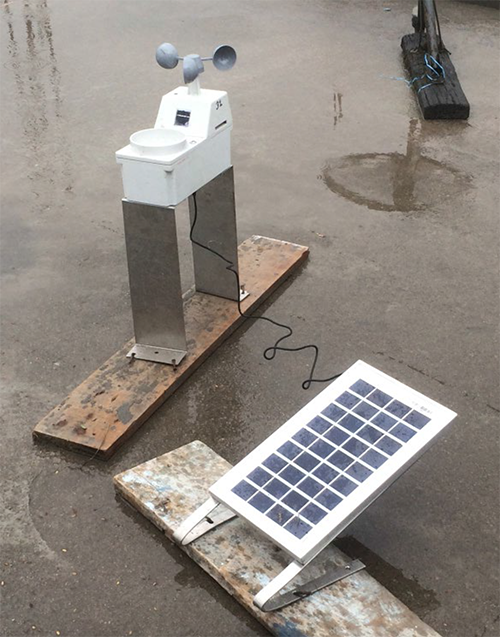
This wind and rainwater data meter is a simple example that is used in some rural areas to get and send data to cellphones via SMS. I would use something similar but connected to Lora network to share the data.
PD.4. Value proposition
Creating a superlocal weather station for educational learning. Designed as a starter kit for environmental data collection, the device will gather realtime information from 4 different weather sensors: a wind gauge, a rain gauge, a thermometer and a humidity sensor.
PD.5. Model design
After many drawing ideas, I got the final idea to develop:
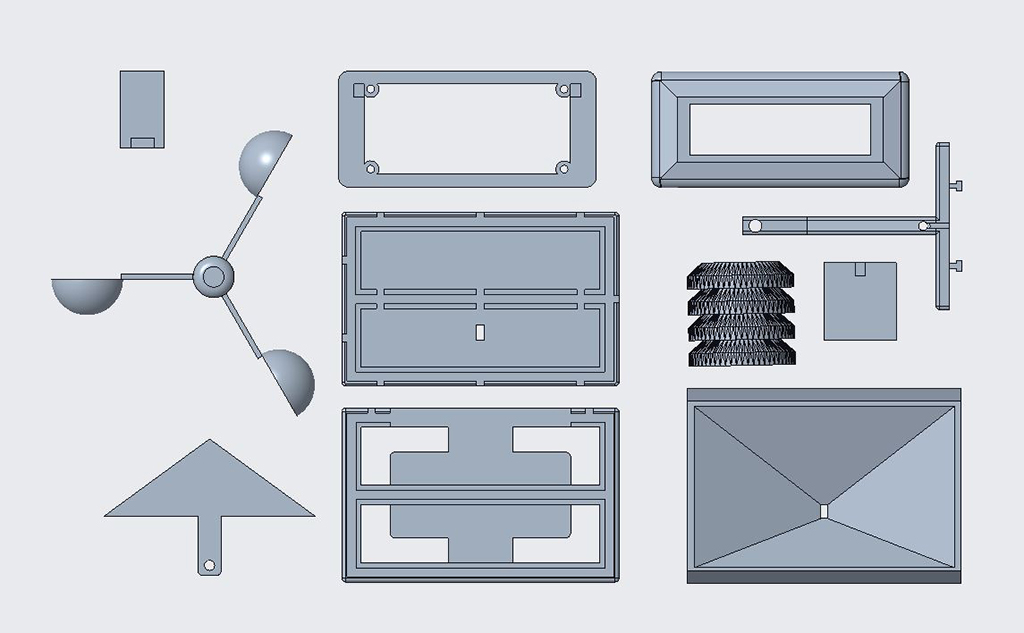
Then I started modelling each part on CreoParametric. Using processes of extruding, revolving, creating patterns and swiping surfaces, I designed all the elements
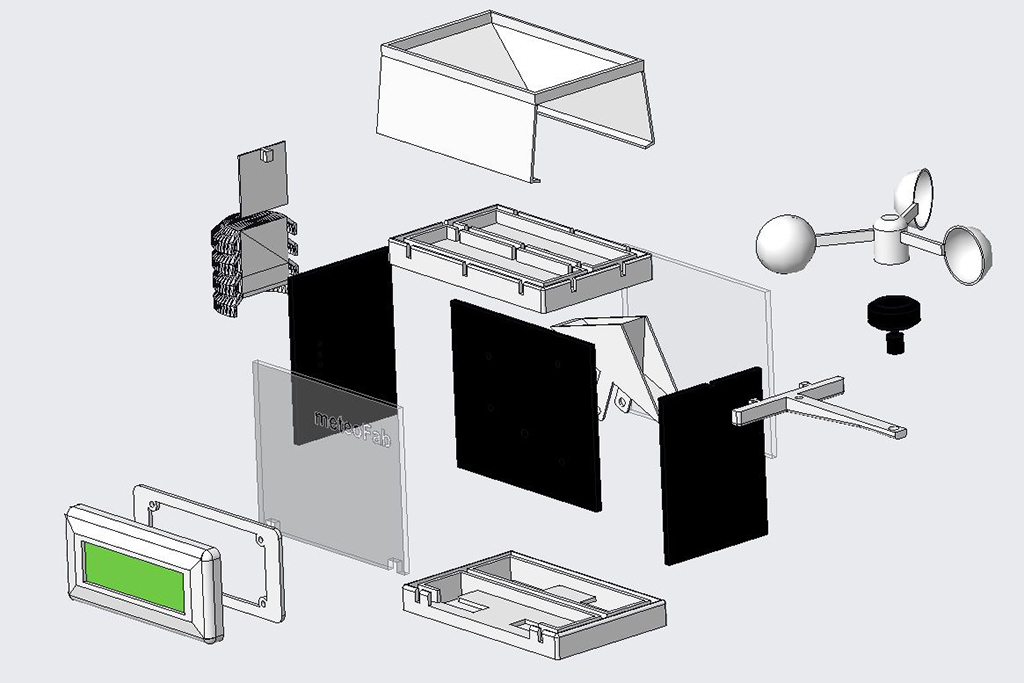
Here you can see the clipping system I used to join all the parts. I also made M4 holes to screw the screen to its case.
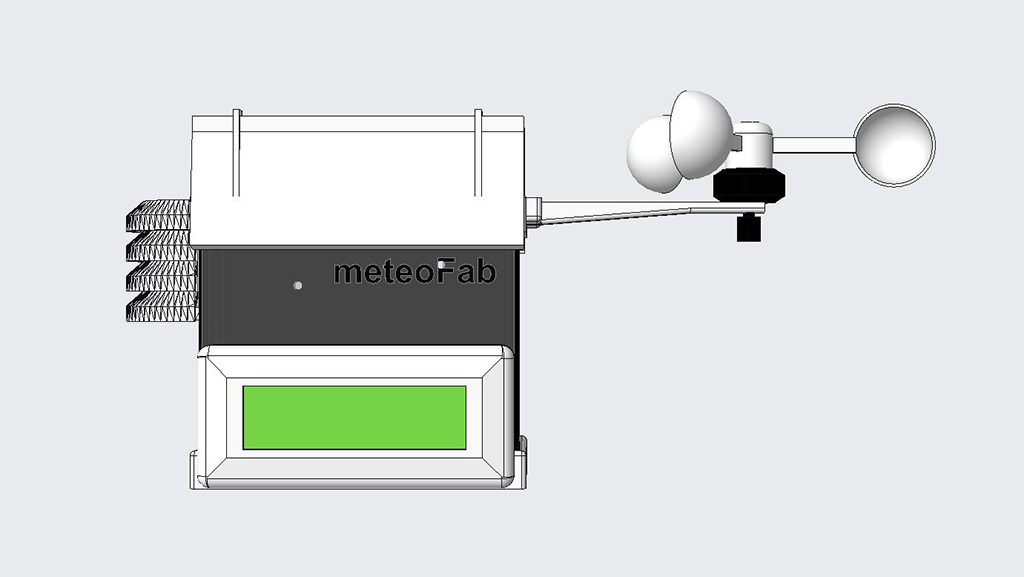
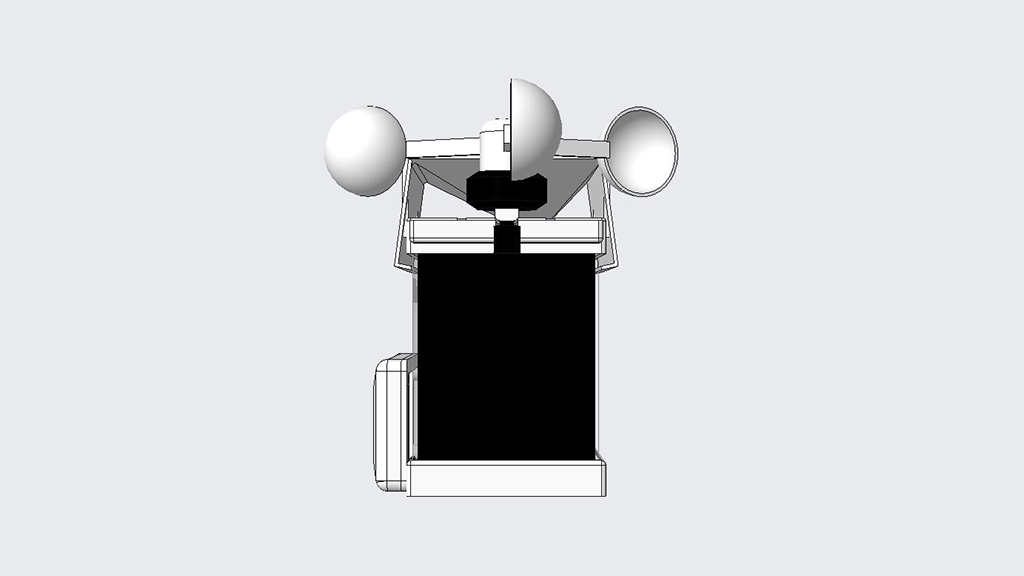
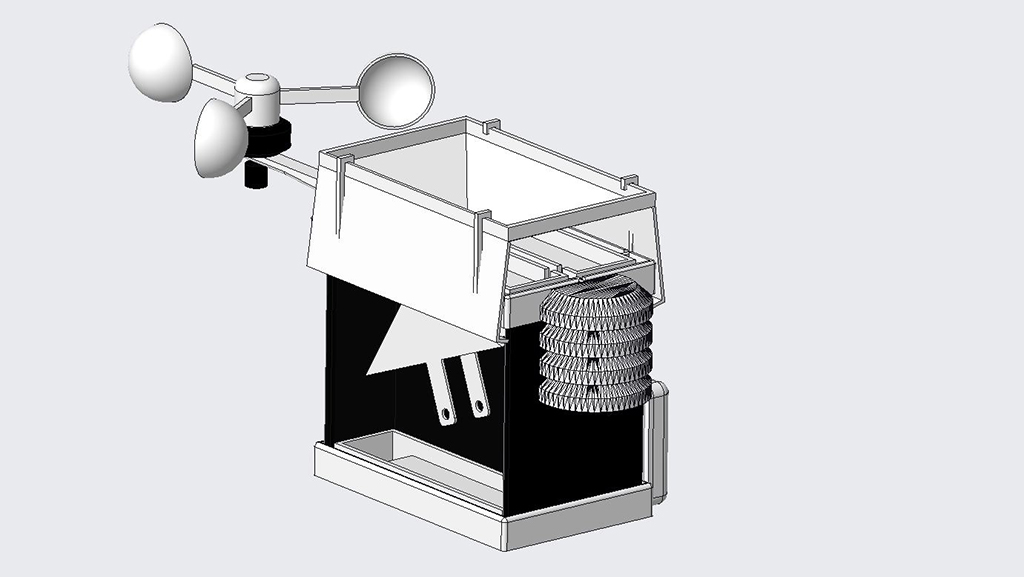
This is the final look of the model assembled:
And the 3 sensor modules:
This is a exploded view to show all the connections:
PD.6. Components
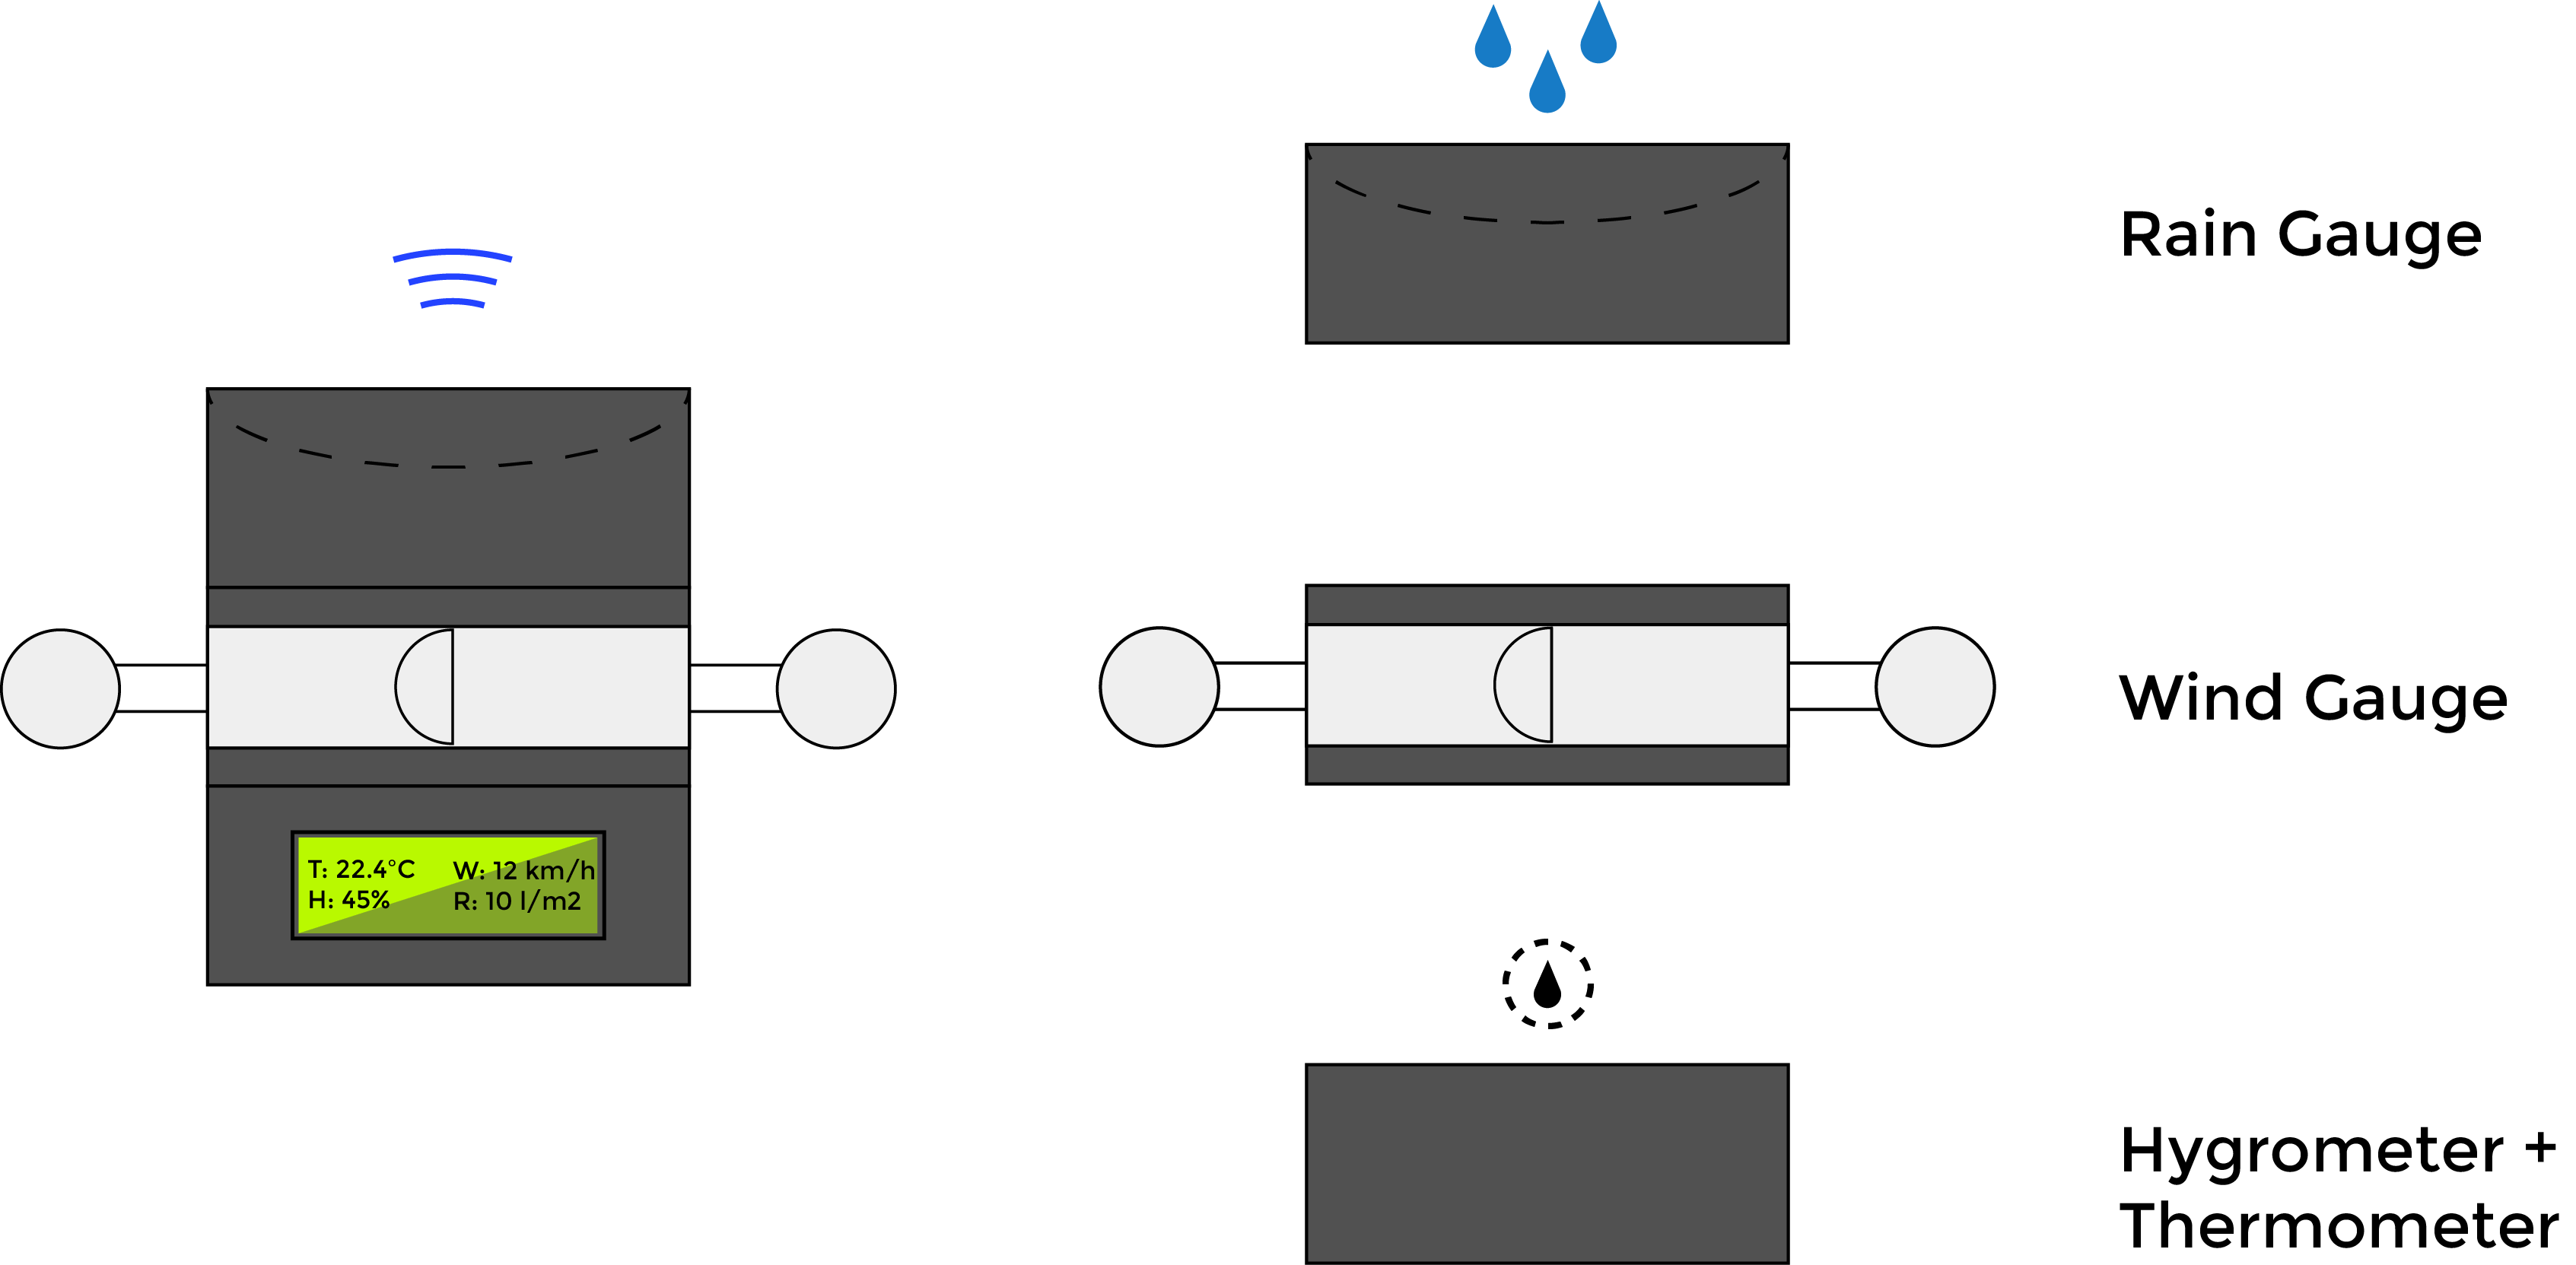
The next diagram shows the two options I explained on the previous question. In both cases, the scheme of components and functions are the same.
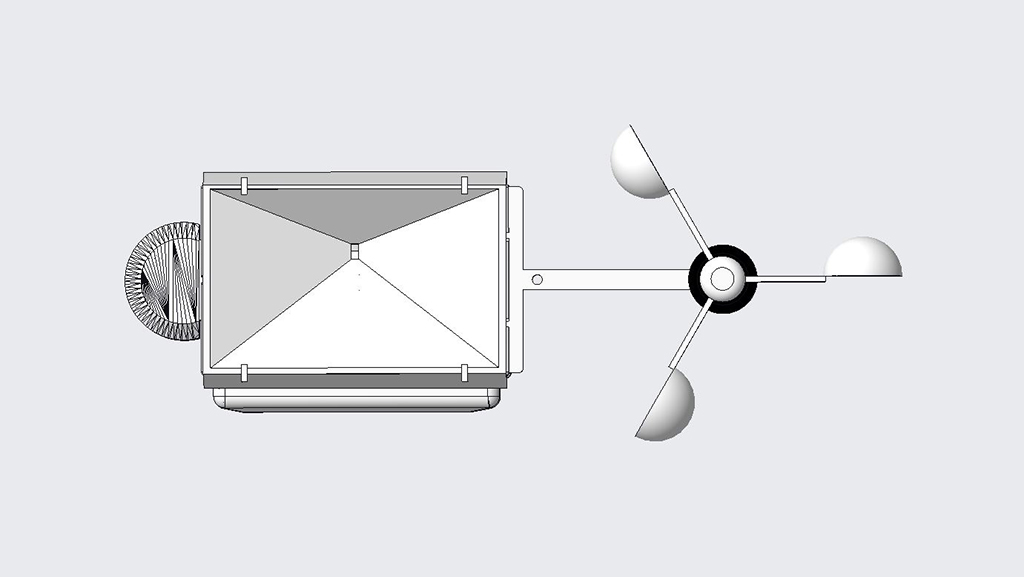
6.1. MECHANICAL COMPONENTS
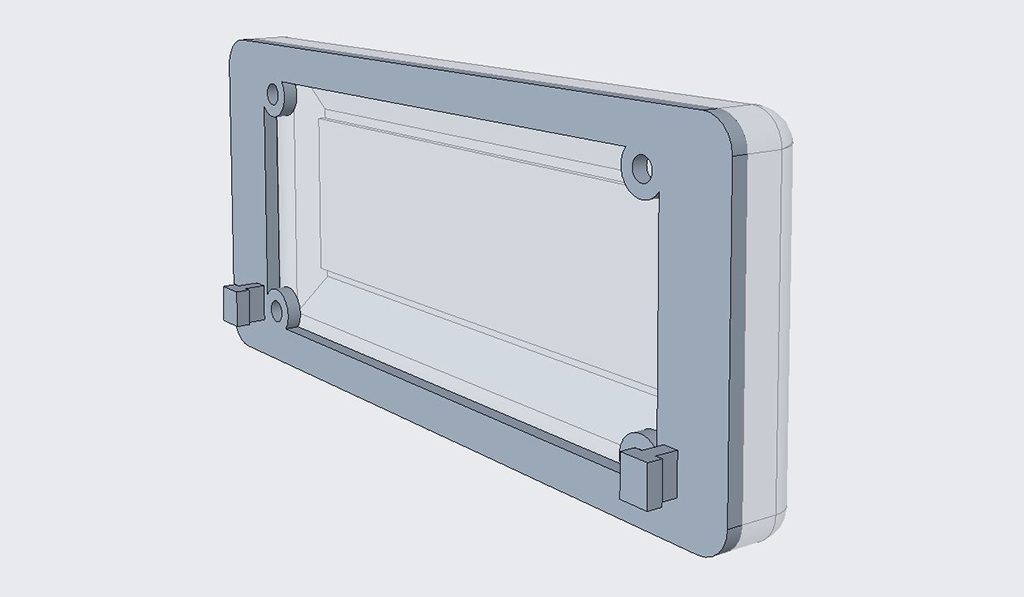
The hardware components (LCD screen, Stevenson screen, rain gauge basin and anemometer) due to their modularity, can be attathed or removed easily with clips to the upper and lower bases of the main case. So the mechanical components can be divided into:
- Case.
The main case encloses all the electronic sensors in the interior and it is divided in two spaces: one for protecting the electronics core, and one for isolating the rain gauge chamber. The walls are made of acrylic plastic of 3mm embedded into the top and bottom bases' perimetral grooves.
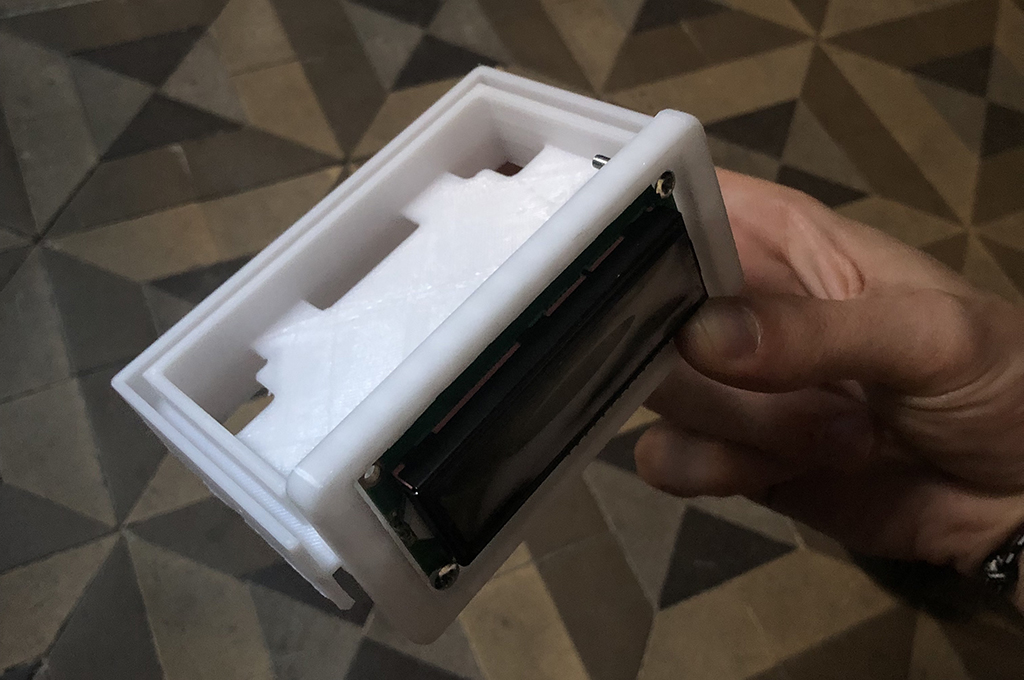
- LCD screen protector.
The display is enclosed into a 3d printed PLA case to protect it from the outdoors and to clip it to the bottom base.
- Stevenson screen for DHT22 sensor.
This component is a widely known model that I got from the Pluvi.On community
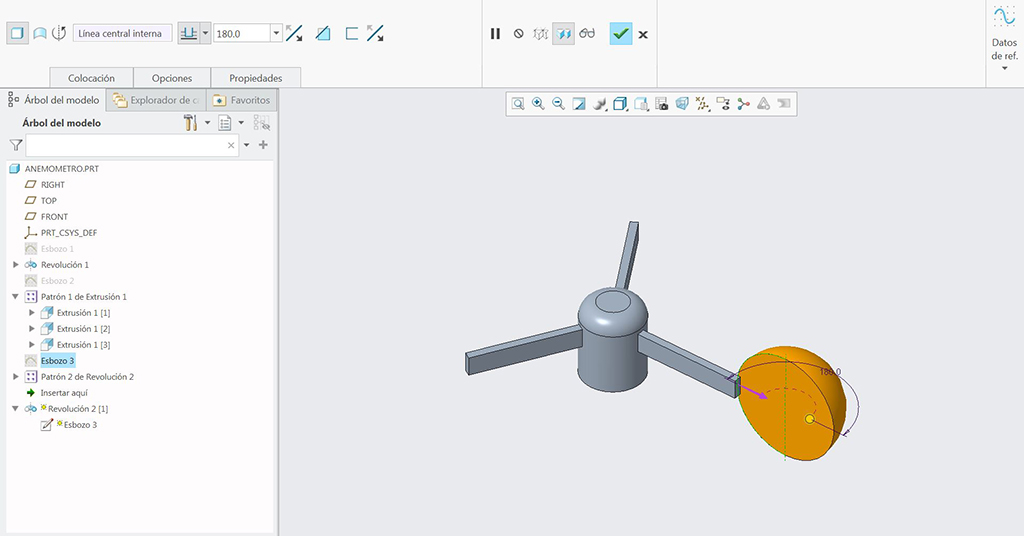
- Anemometer.
The anemometer is divided in three different parts: the branch that separates the mechanism from the box, the 3 blade anemometer that encloses the magnet for the hall sensor, and the bearing-screw-nut joint that will make the blades turn free around the endpoint of the branch.
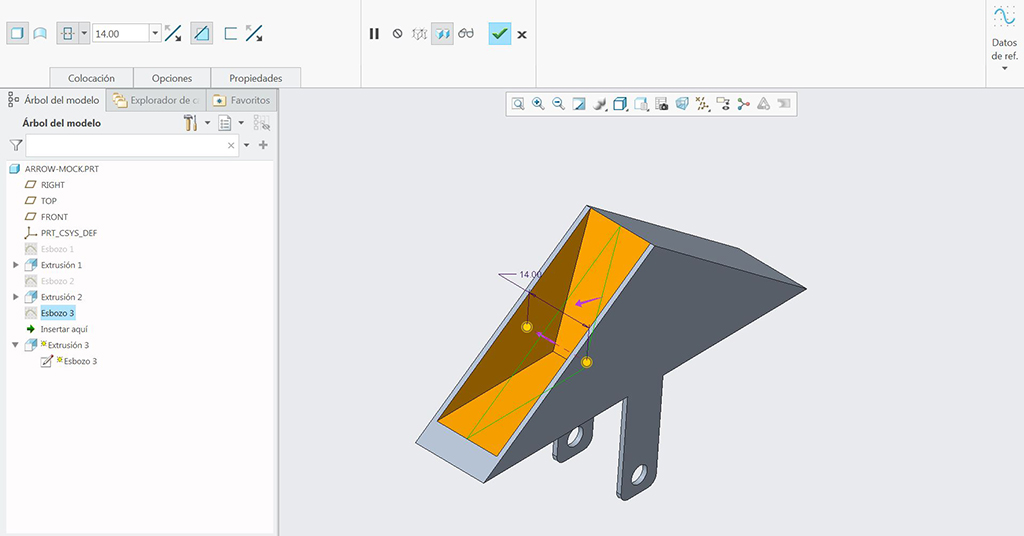
- Rain gauge mechanism.
The rain gauge is made of a 3d printed arrow model that I got again from the same Pluvi.On community, that swings around an axis attatched to the middle wall in the case.
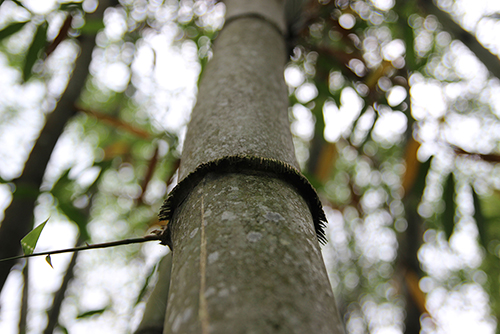
- Rain gauge basin.
The basin to collect the rainwater is made again in one piece of 3d printed PLA that is clipped on top of the upper base.
6.2. ELECTRONIC COMPONENTS
The electronic components I used for the project are the following:
Fabduino shield:
- Microcontroller: ATMEGA 328P
- Resistor: 499 ohms
- Capacitor (unpolarized): 10 uF
- Capacitor (unpolarized): 1 uF
- Capacitor (unpolarized): 0.1 uF (x2)
- Resonator: 8 MHz
- LED: 1206SMD
- Switch: 6 mm
- Header: 6 pin
- Pin header: 8 pin
Sensor shield:
- DHT22 sensor
- Hall effect sensor 44e402 (x2)
- 10 kohm resistor
- 8 female pin header (x2). To connect analog and digital pins from the board
- 9 female pin header. To connect ISP for programming and other pins from the board
- 3 female pin header (x4). To connect sensors as inputs (GND, VCC and DATA), and output connections for further elements (GND, 3.3V and 5V)
- 4 female pin header. To connect the LCD as an output (GND, VCC, SCL ans SLA)
- 3.3V battery
PD.7. List of materials
The materials I'll be using for the first version are:
- Acrylic 3mm (transparent)
- Acrylic 3mm (black)
- PLA fillament for 3D printing
- 4 M3 screws, nuts and wahsers (for the LCD case)
- 1 M4 screw, nut, washer and a 10mm bearing for the anemometer
- 3 round 10mm neodymium magnets
- 1 LCD screen + i2c module
- 1 fabduino
- 1 sensor shield
- 1 fabISP + serial bus for programming
- 1 DHT22 temp and humidity sensor
- 2 Hall effect sensors
- Wires for connections
- Soldering material (week5)
PD.8. Hardware production
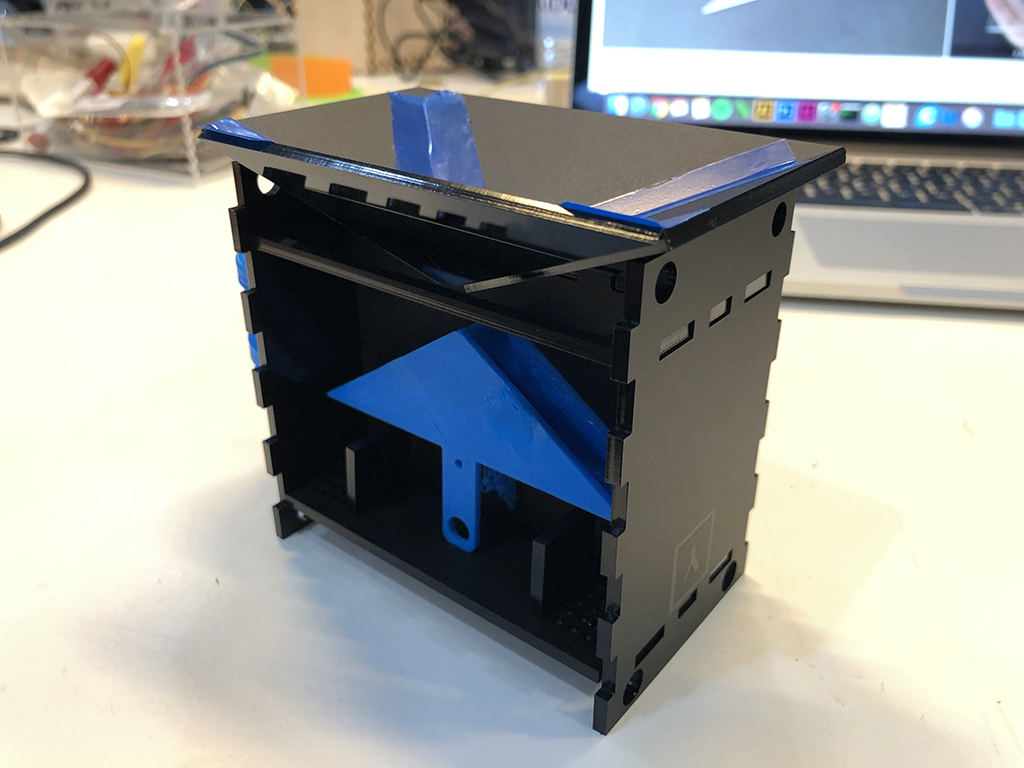
8.1. PROTOTYPE I
First I started producing the Pluvi.On device to test the sensors myself and redesign some parts later.
And then, started assemblying all the pieces:
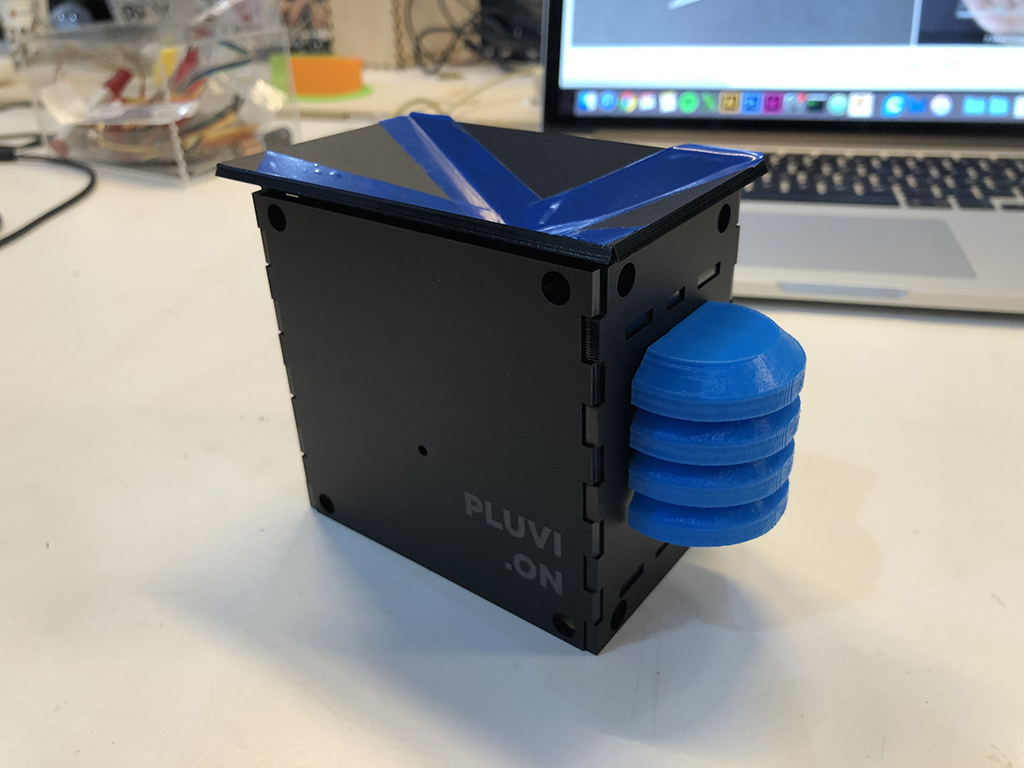
8.2. PROTOTYPE II
Then I 3D printed and assembled the screen case:
Then I created my first prototype with all the elements:
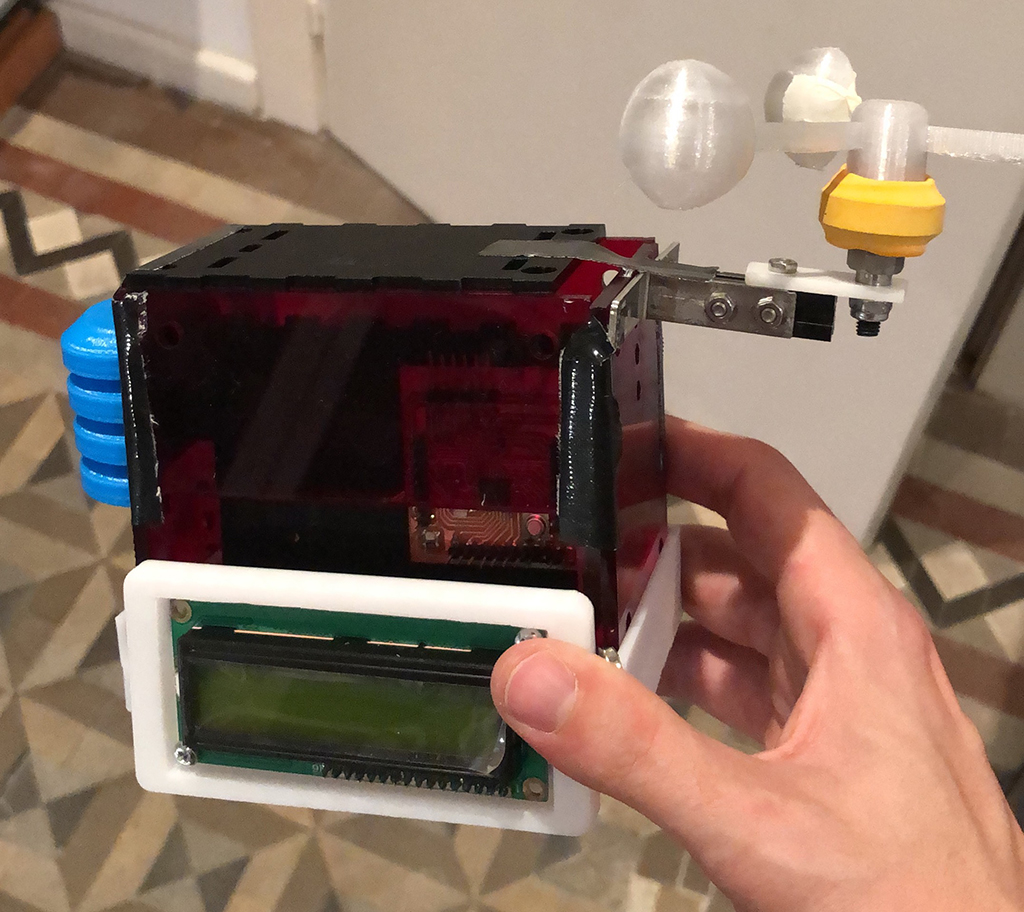
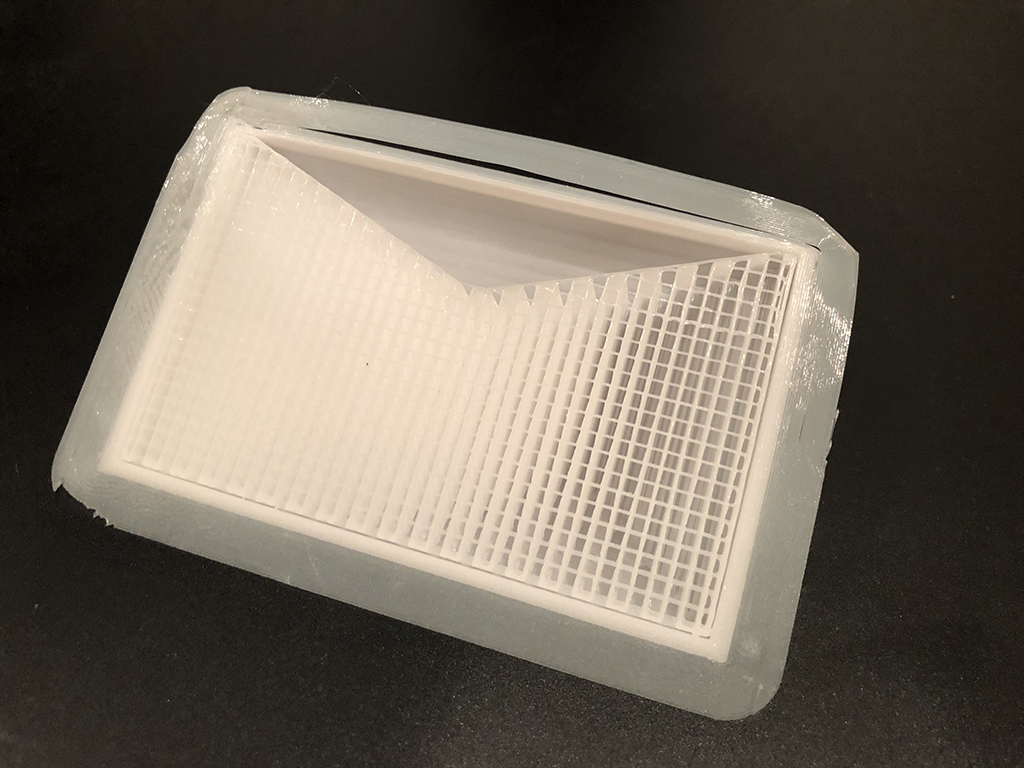
8.3. FINAL PROTOTYPE
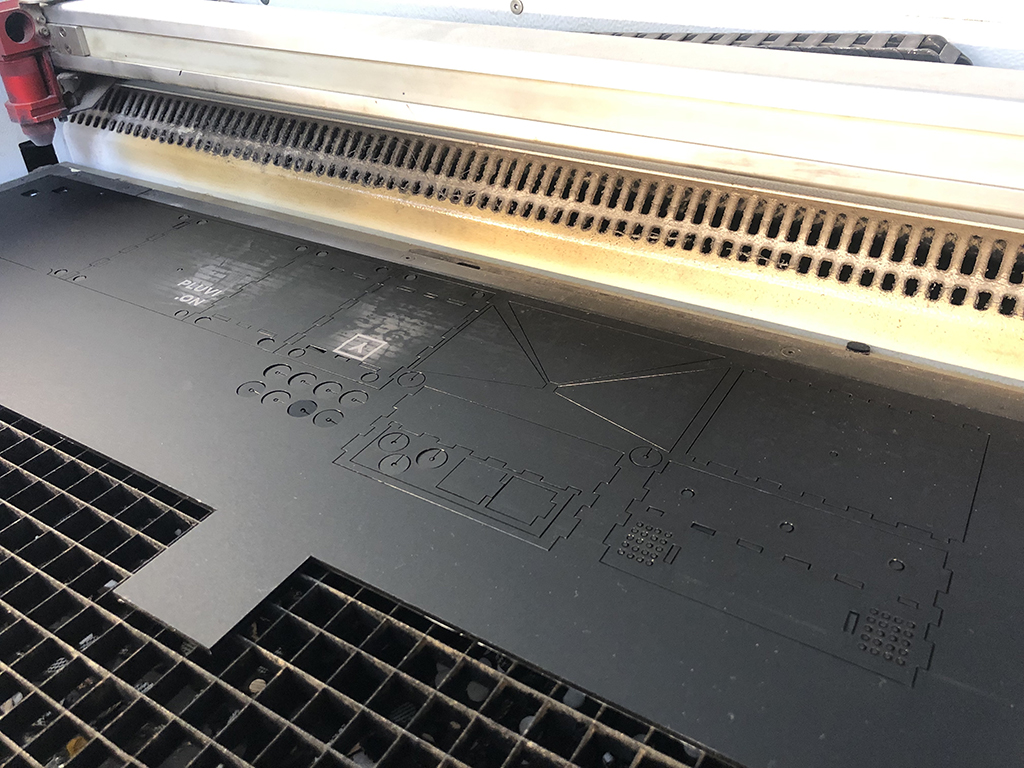
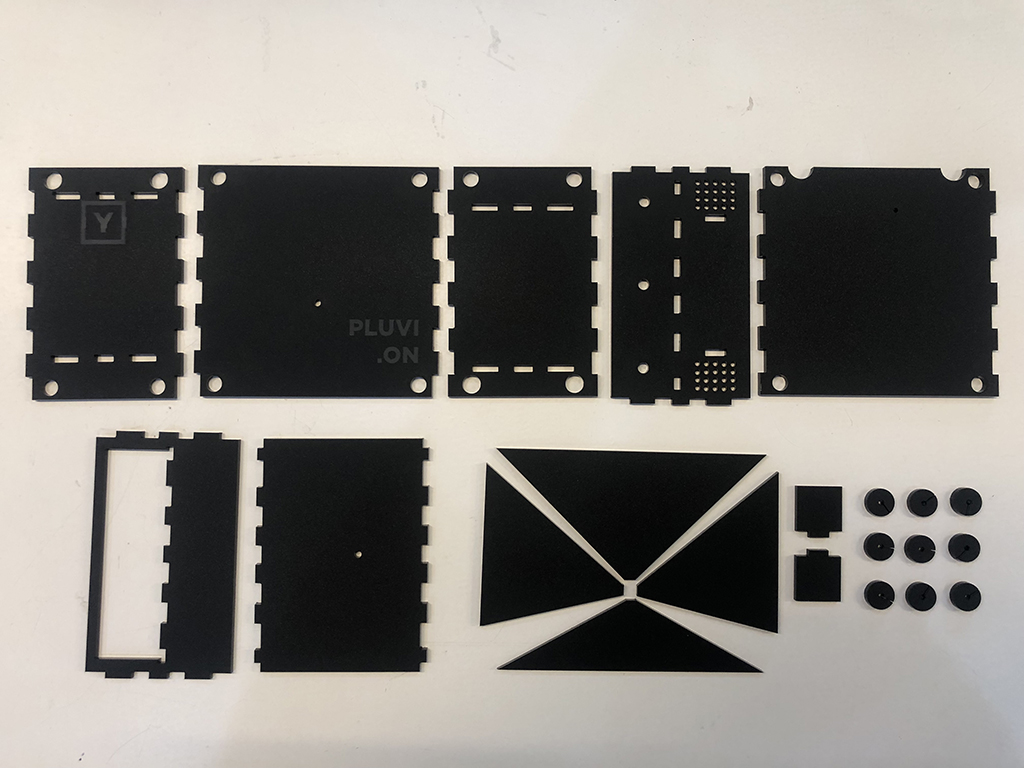
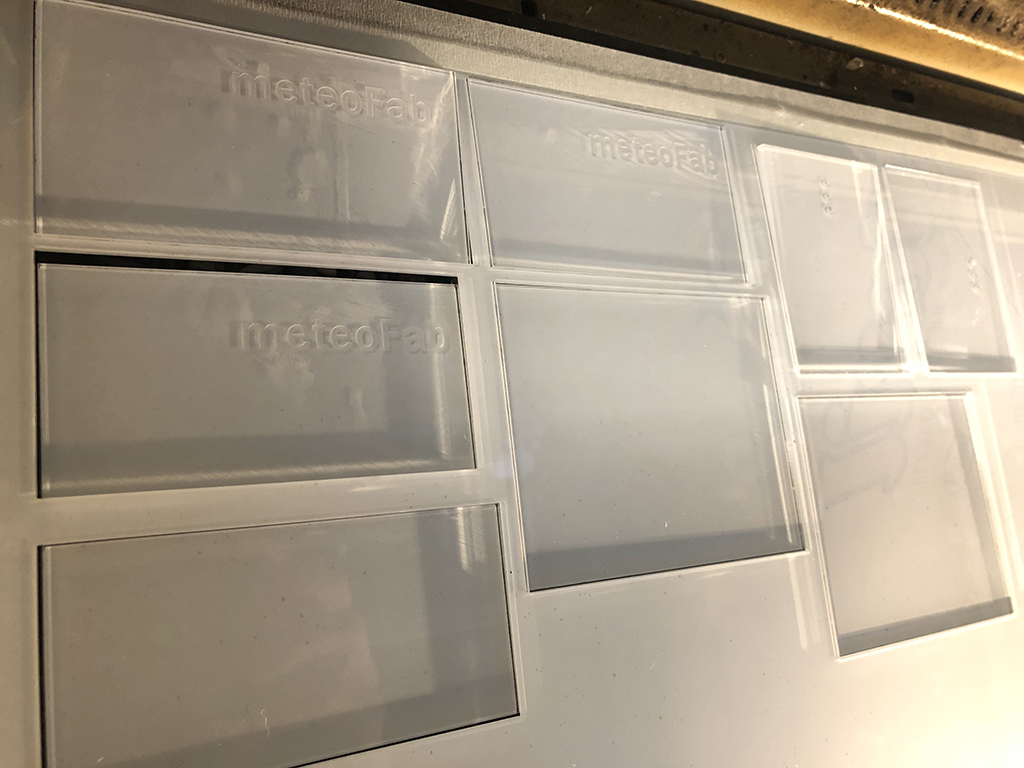
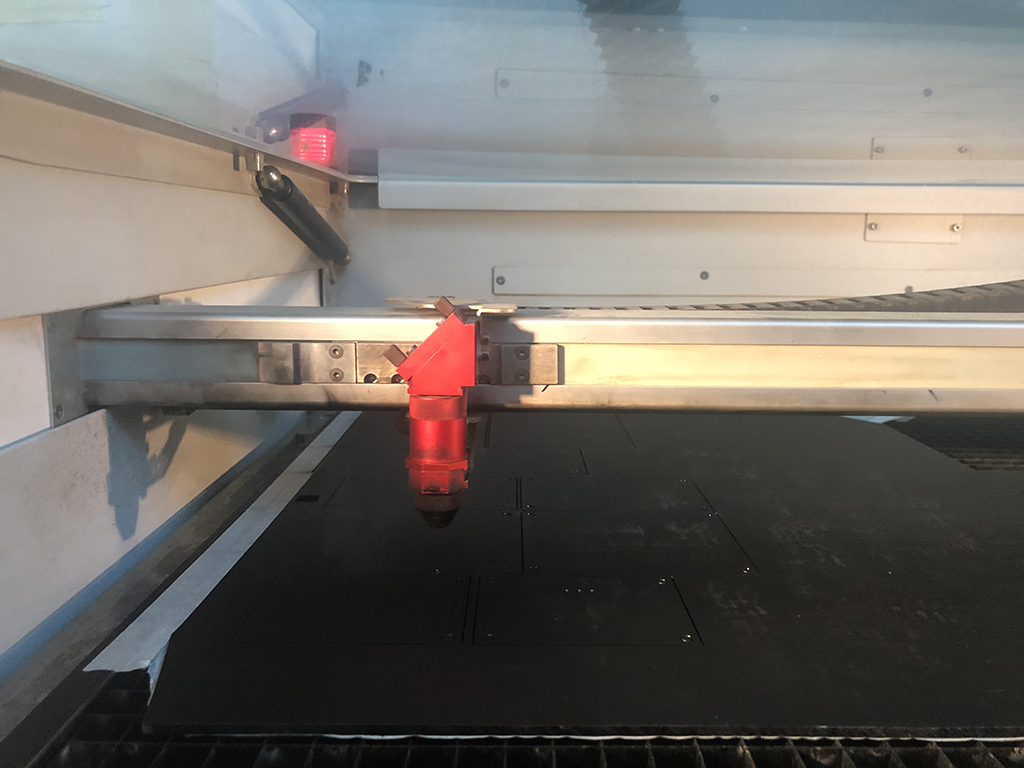
These are the final pieces to cut in laser:
- 2 transparent 100x80mm acrylic rectangles for front and back walls (1 with the rastered meteolab logo)
- 1 black 94x80mm acrylic rectangle for the dividing wall in the middle
- 2 black 54x80mm acrylic rectangles for the side walls
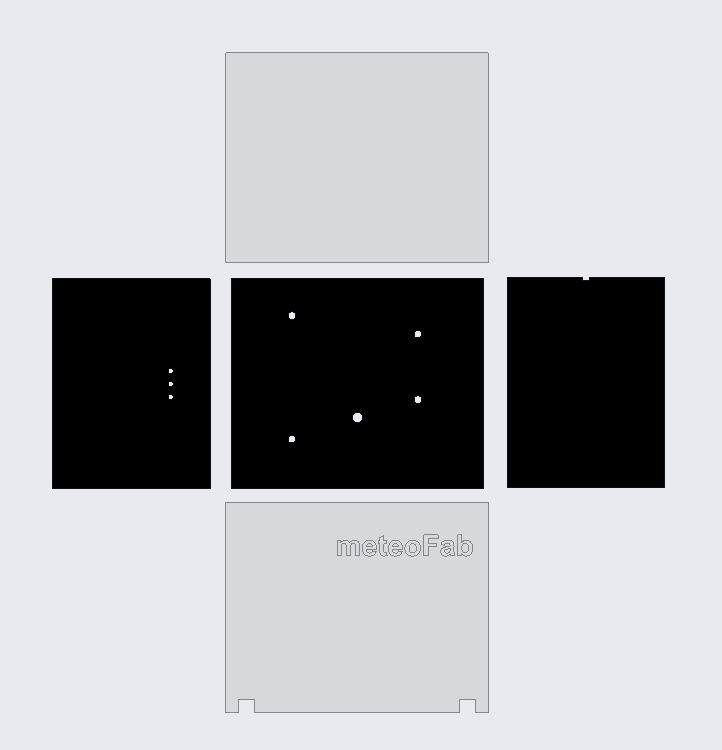
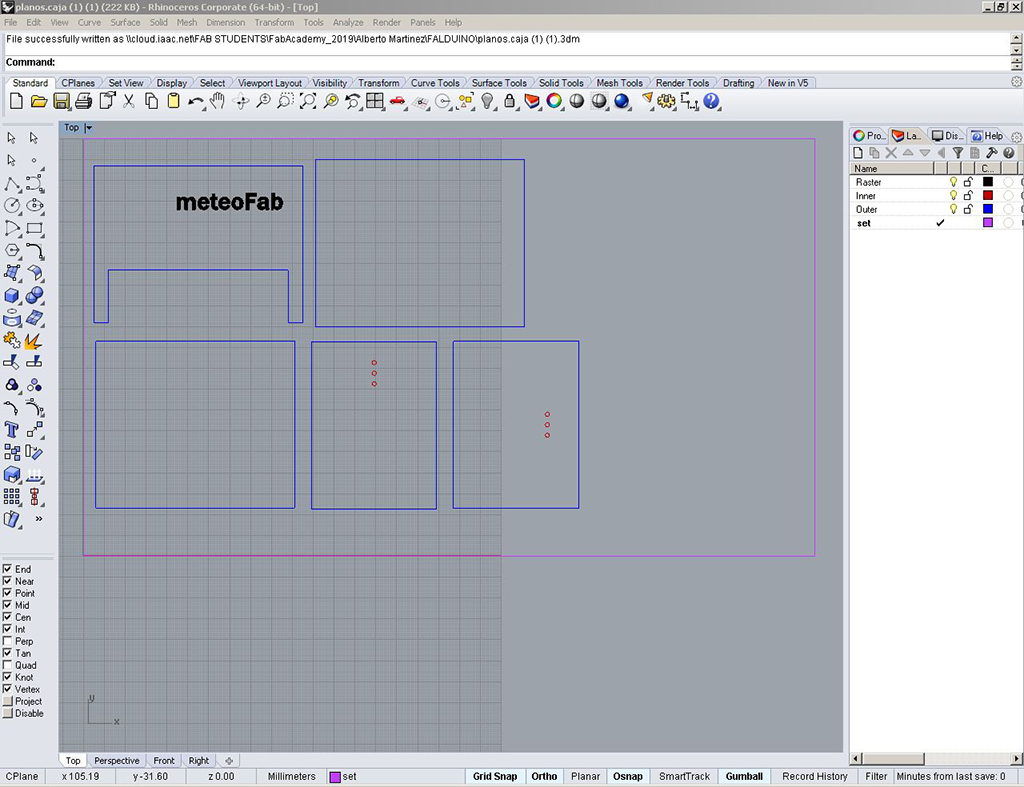
To laser cut the final pieces, I designed them on rhino, setting the colors by layers for outcut, incut and raster:
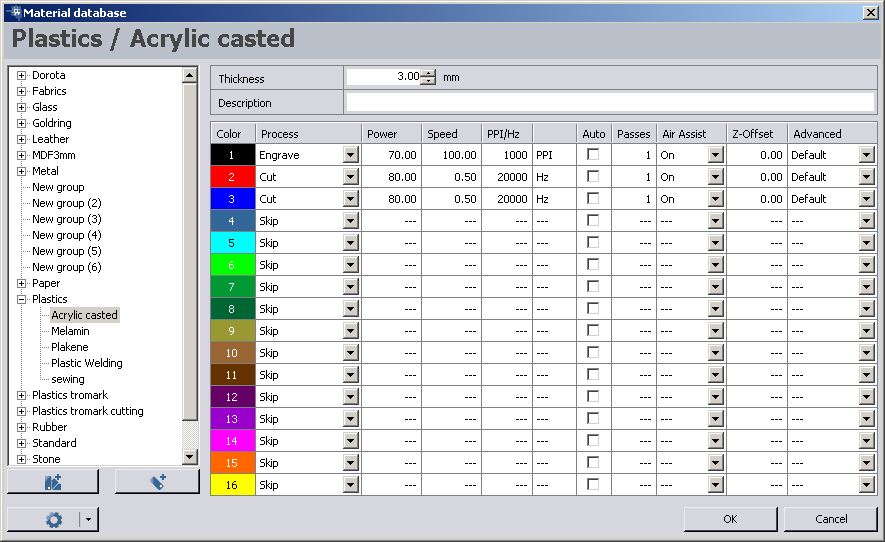
Then on JobControl software, I set the parameters for rastering and cutting the 3mm acrylic board.
This is the cutting process and final result of the pieces:
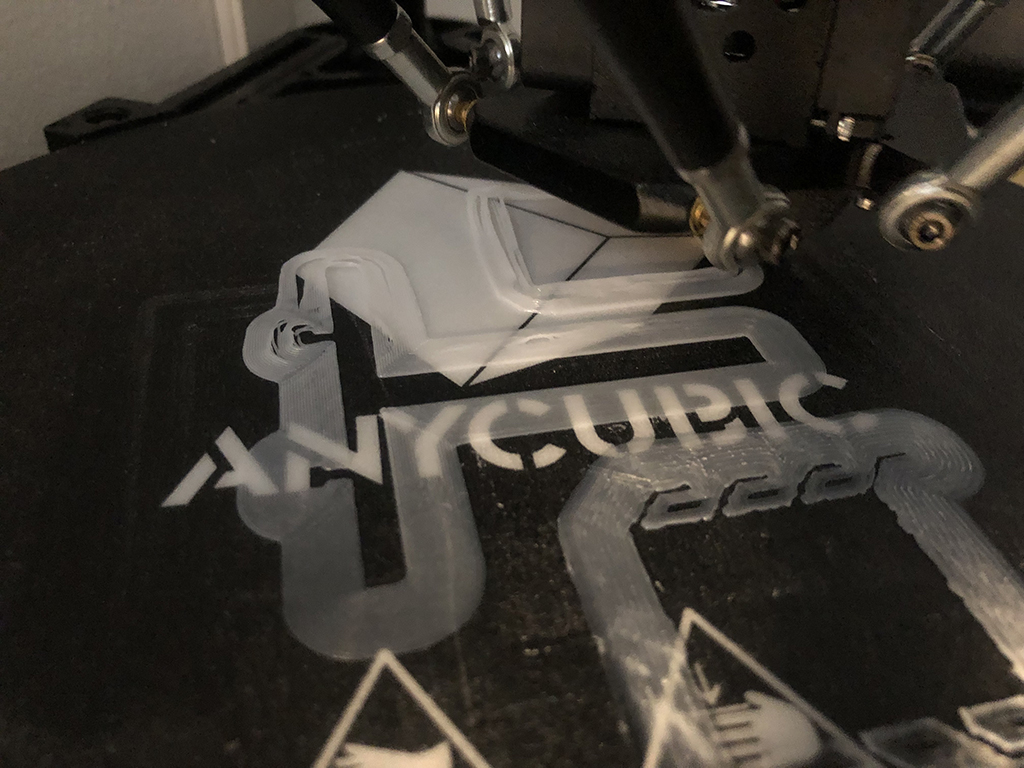
3d printed all the elements:
PD.9. Electronics design
9.1. FABDUINO design
I first made the design on Eagle:
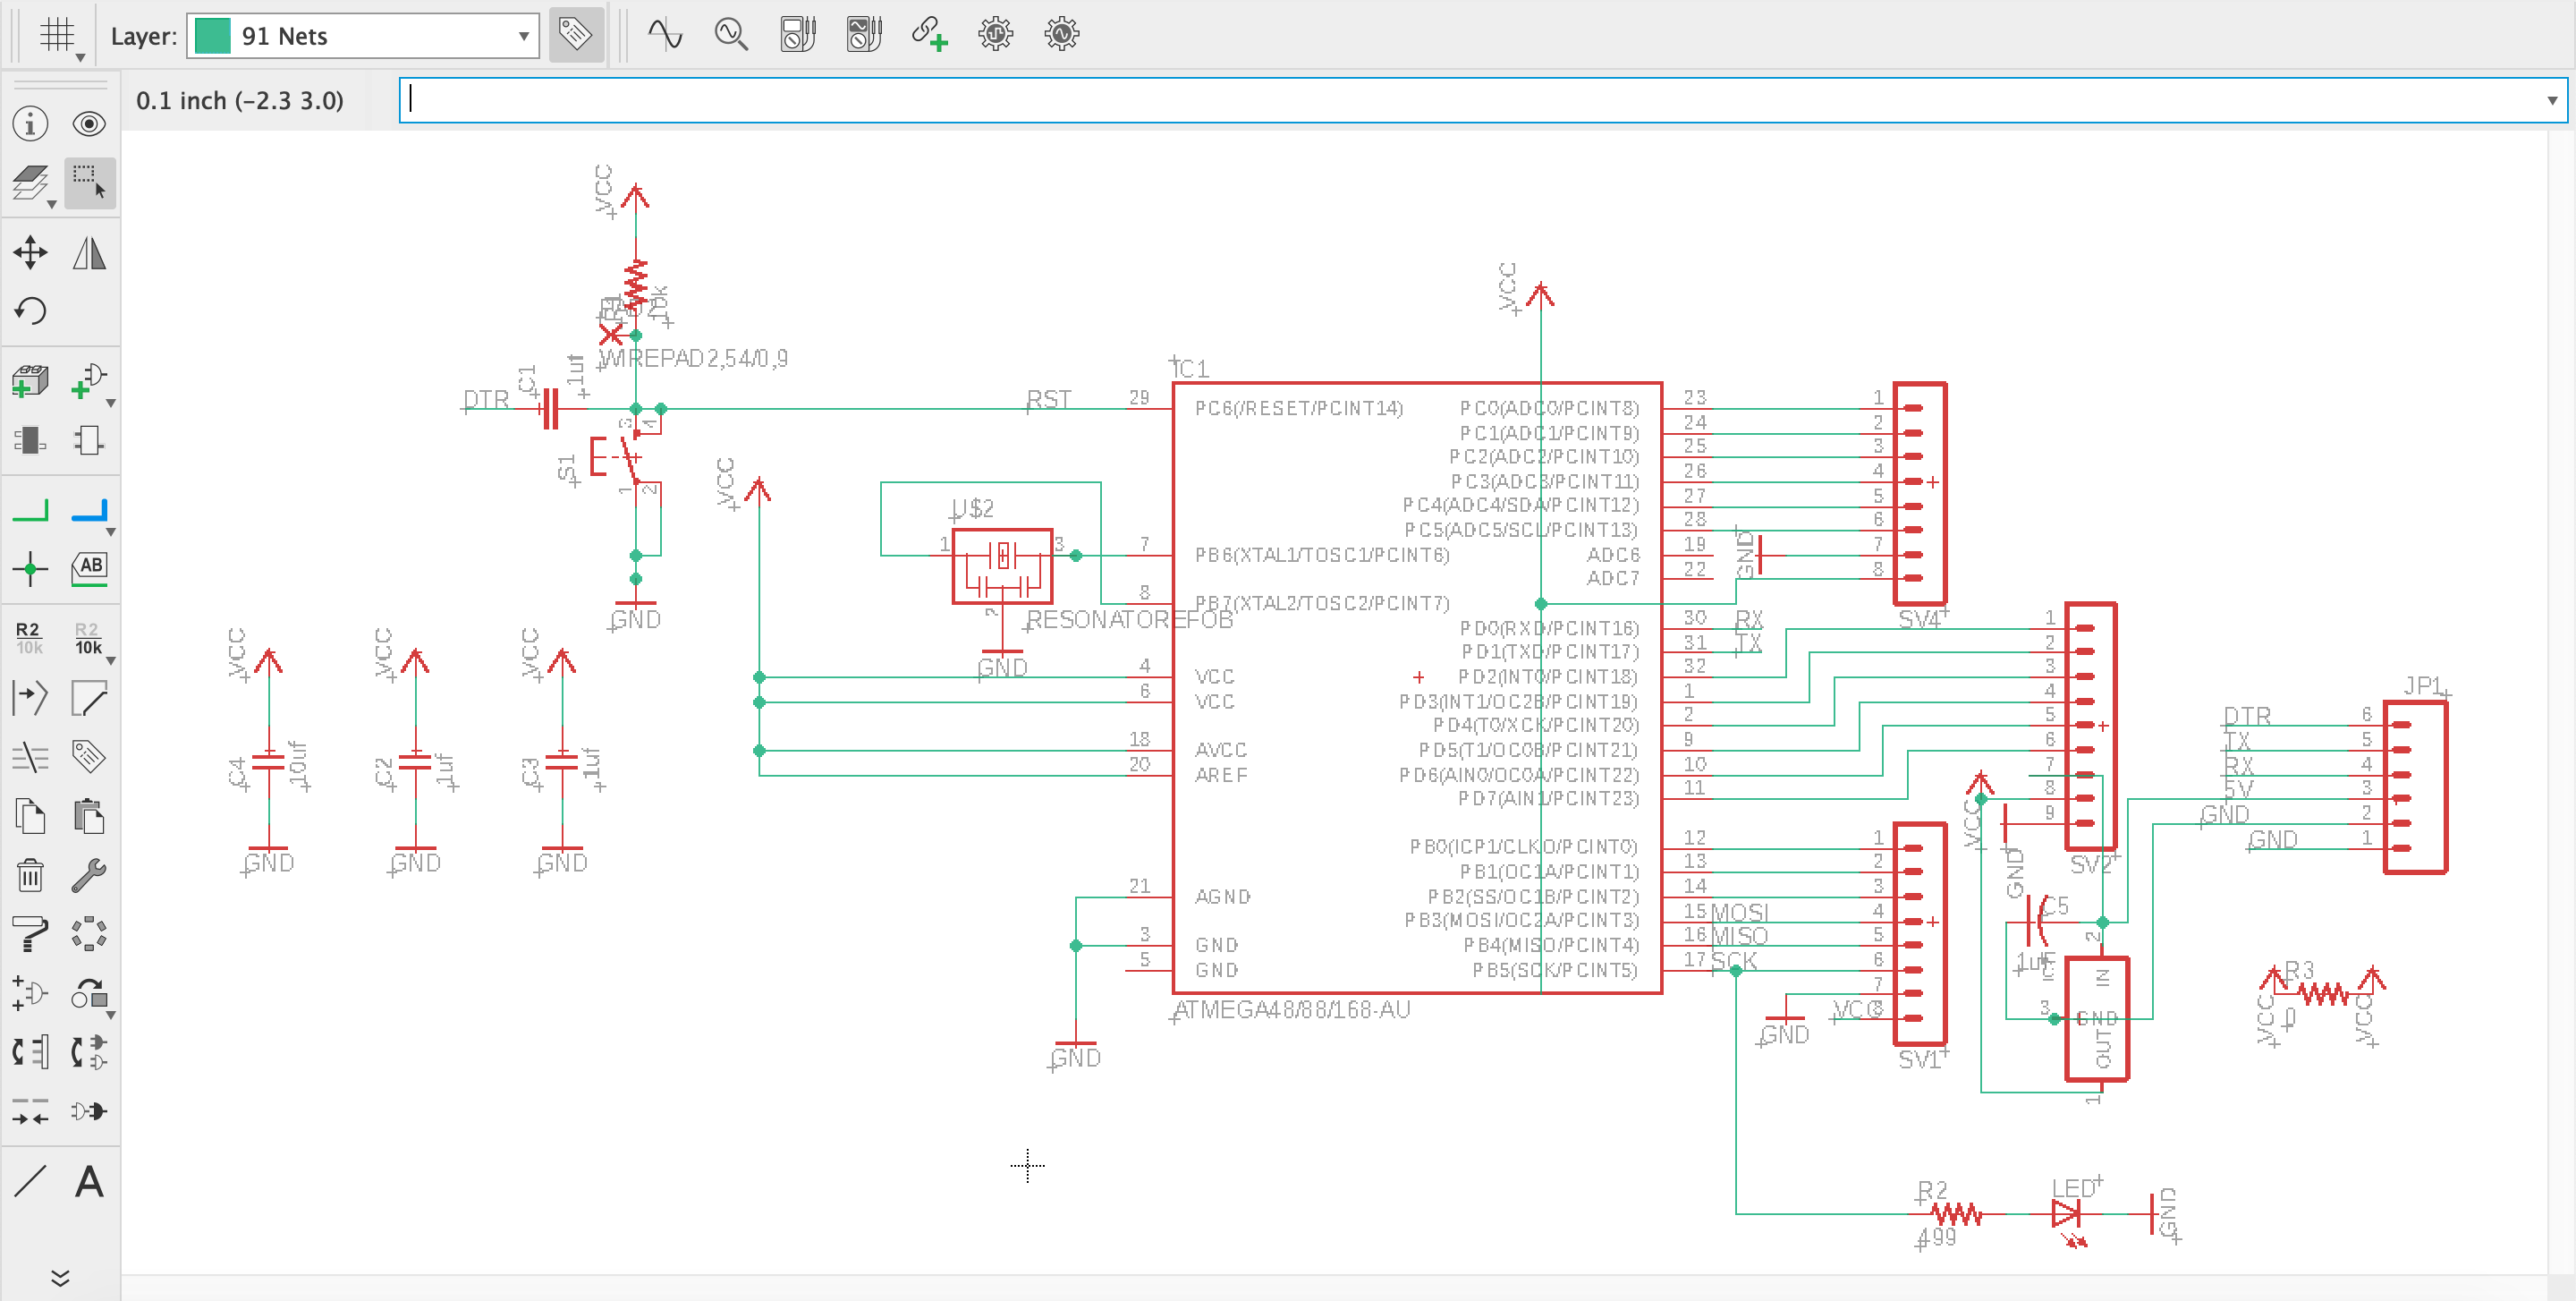
Schematic design
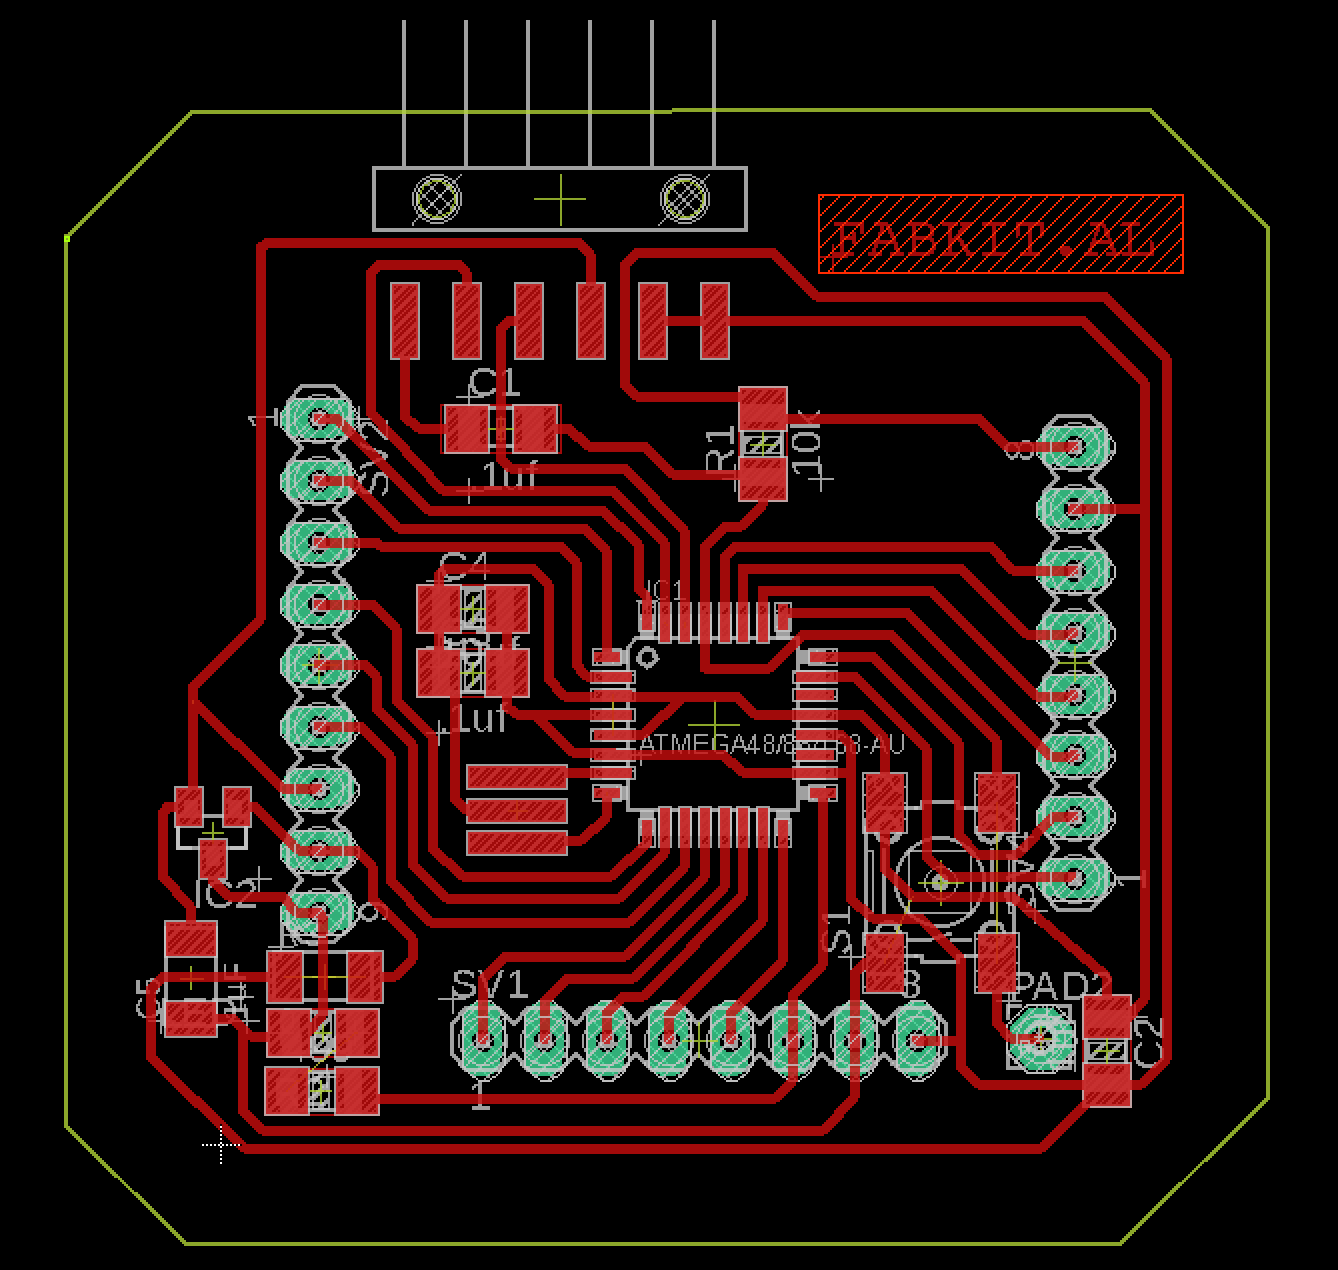
Board design
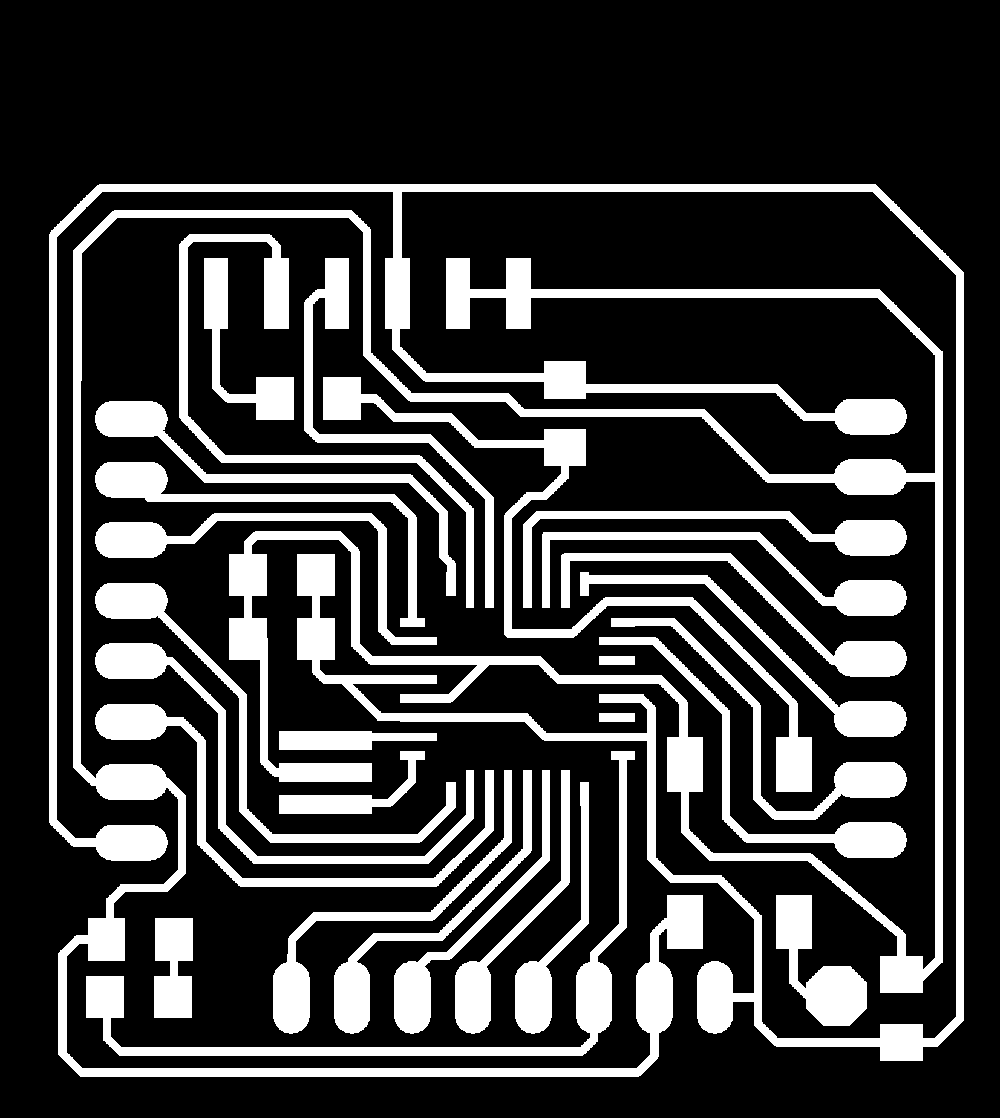
Png files:
Fabduino pinout:
9.2. SENSORS SHIELD design
Components:
DHT22 sensor
As I explained on week11 assignment, the first sensor I am using to test the board is the DHT22 temperature and humidity sensor. This component is widely used in many projects and fields, it is easy to plug and solder anywhere, it gets more accurate readings than other models like the previous one (DHT11) and here you can find more different aspects between both models.
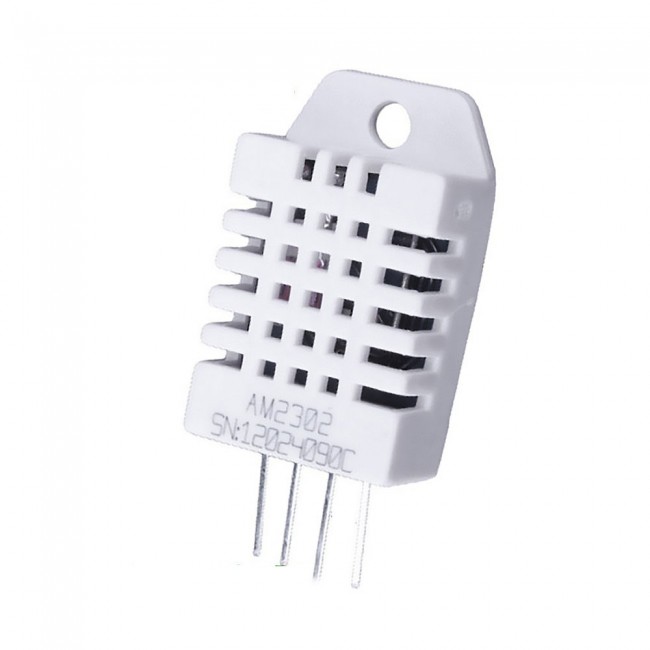
DHT22 humidity and temperature sensor
- Low cost
- 3 to 5V power and I/O
- 2.5mA max current use during conversion (while requesting data)
- Good for 0-100% humidity readings with 2-5% accuracy
- Good for -40 to 80°C temperature readings ±0.5°C accuracy
- No more than 0.5 Hz sampling rate (once every 2 seconds)
- Body size 15.1mm x 25mm x 7.7mm
- 4 pins with 0.1" spacing
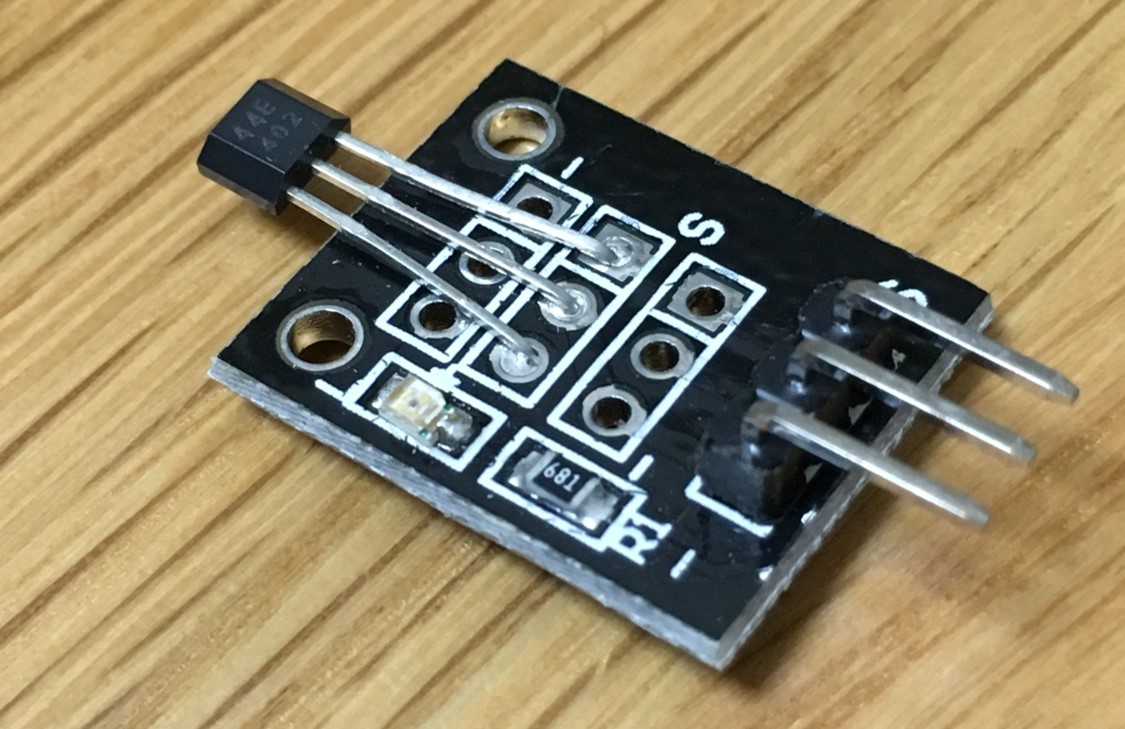
Hall effect sensor
The other sensor I am using is the Hall effect sensor. This device is used for measuring magnetic fields and currents, so it can be used as an activator, interruptor, lap counter, or position determinator, as long as its magnetic cell detects the presence of a magnet (in a distance less than 2 cm), it will shut the current as a GND connection. The sensor has 3 connector pins to GND, VCC and DATA.
As an electronic switch:
- It costs less than a mechanical swithch and is much more reliable.
- It can be operated at higher frequencies than a mechanical switch.
- It suffers less from contact than mechanical switch.
- It will not be affected by environmental contaminants as it is contained in a sealed package, so it can be used under severe conditions.
As a linear sensor (for magnetic field strength measurements):
- It can measure wide range fo magnetic fields.
- It can measure either North or South pole magnetic fields.
- It can be flat
However, it provides much lower measuring accuracy than fluxgate magnetometers or magnetoresistance-based sensors. It drifts significantly, requiring compensation.
Some specs:
- Model: KY-003
- Operating voltage: 5V(DC)
- Supply voltage, VCC: 28V
- Reverse battery voltage, VRCC: -35V
- Magnetic FLux Density, B: Unlimited
- Output OFF voltage, Vout: 28V
- Reverse Output voltage: -0.5V
- Continious output current, IOUT: 25mA
- Operating temperature range: -40ºC to 85ºC
- Storage temperature range: -65ºC to 170ºC
Some features:
- 4.5V to 24V compensation
- Open-collector 25mA
- Activate with small, commercially available permanent magnets
- Small size (length:19mm - width: 15mm)
- Resistant to physical stress
Design on Eagle:
Schematic design
Board design
Png files:
PD.10. Electronics production
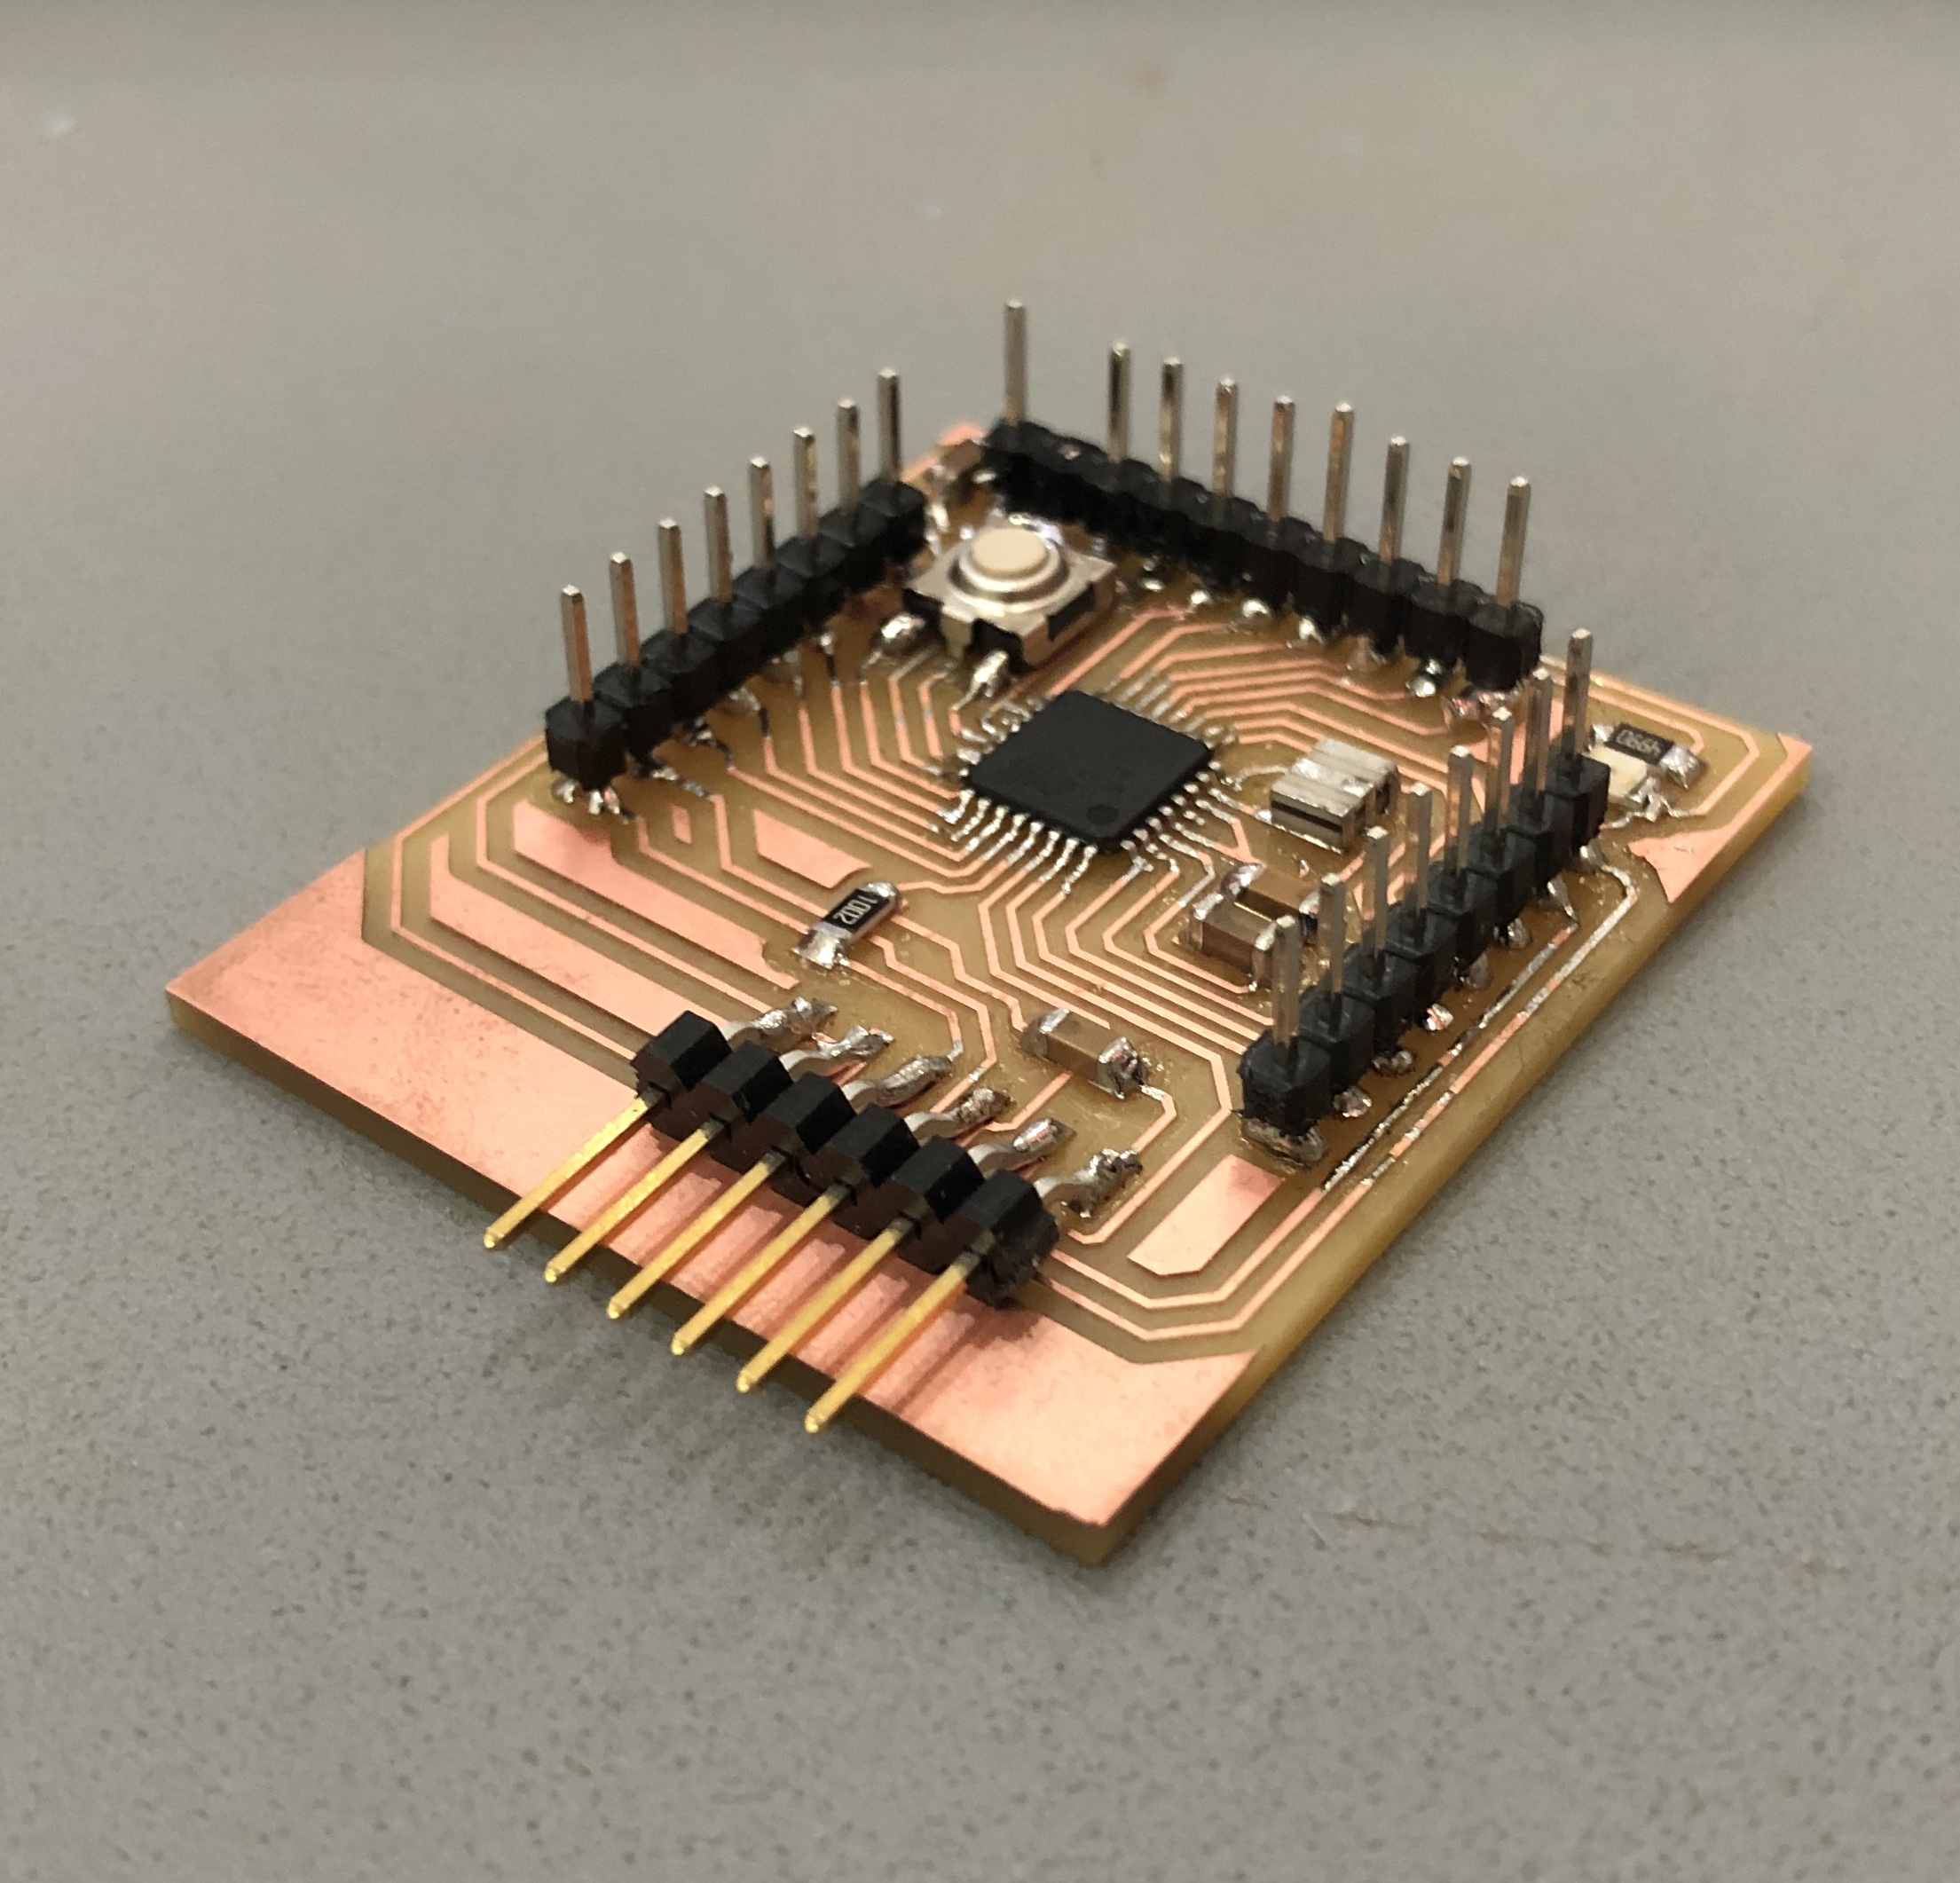
10.1. FABDUINO production
After the redesign of my board, I put it together with the hat sensor shield for the milling process and did it at once:
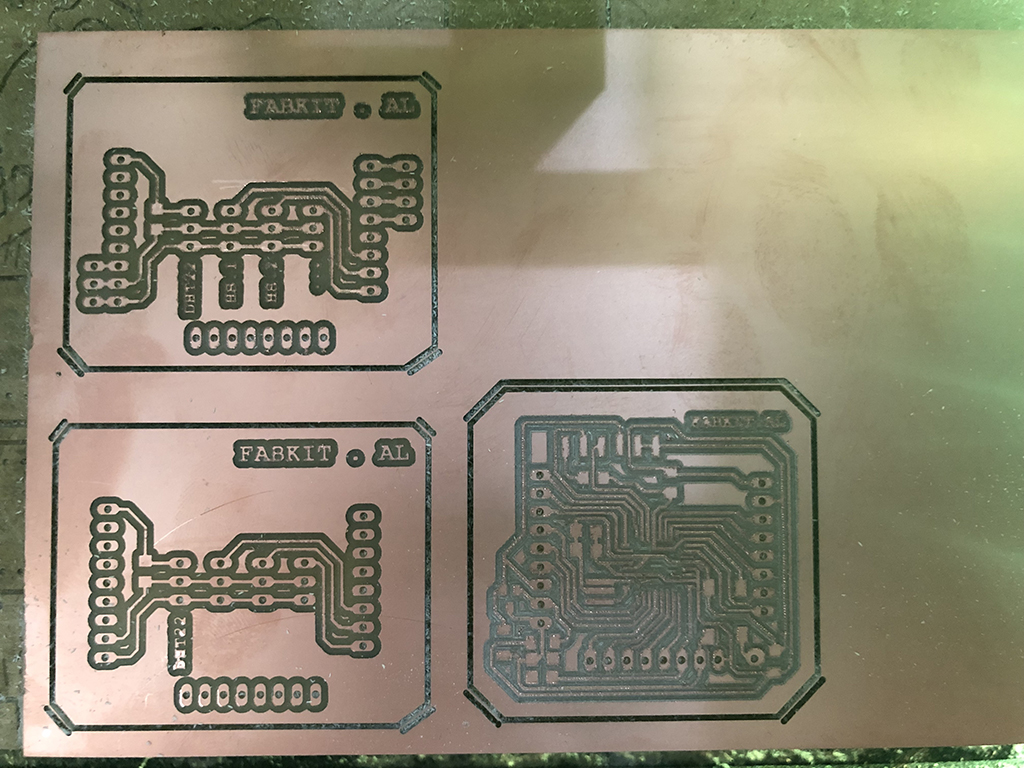
The finishing on the milled board was way worse than on the shields, so I had to polish it with metal wool and clean it with alcohol to get better results, the difference is quite visible:
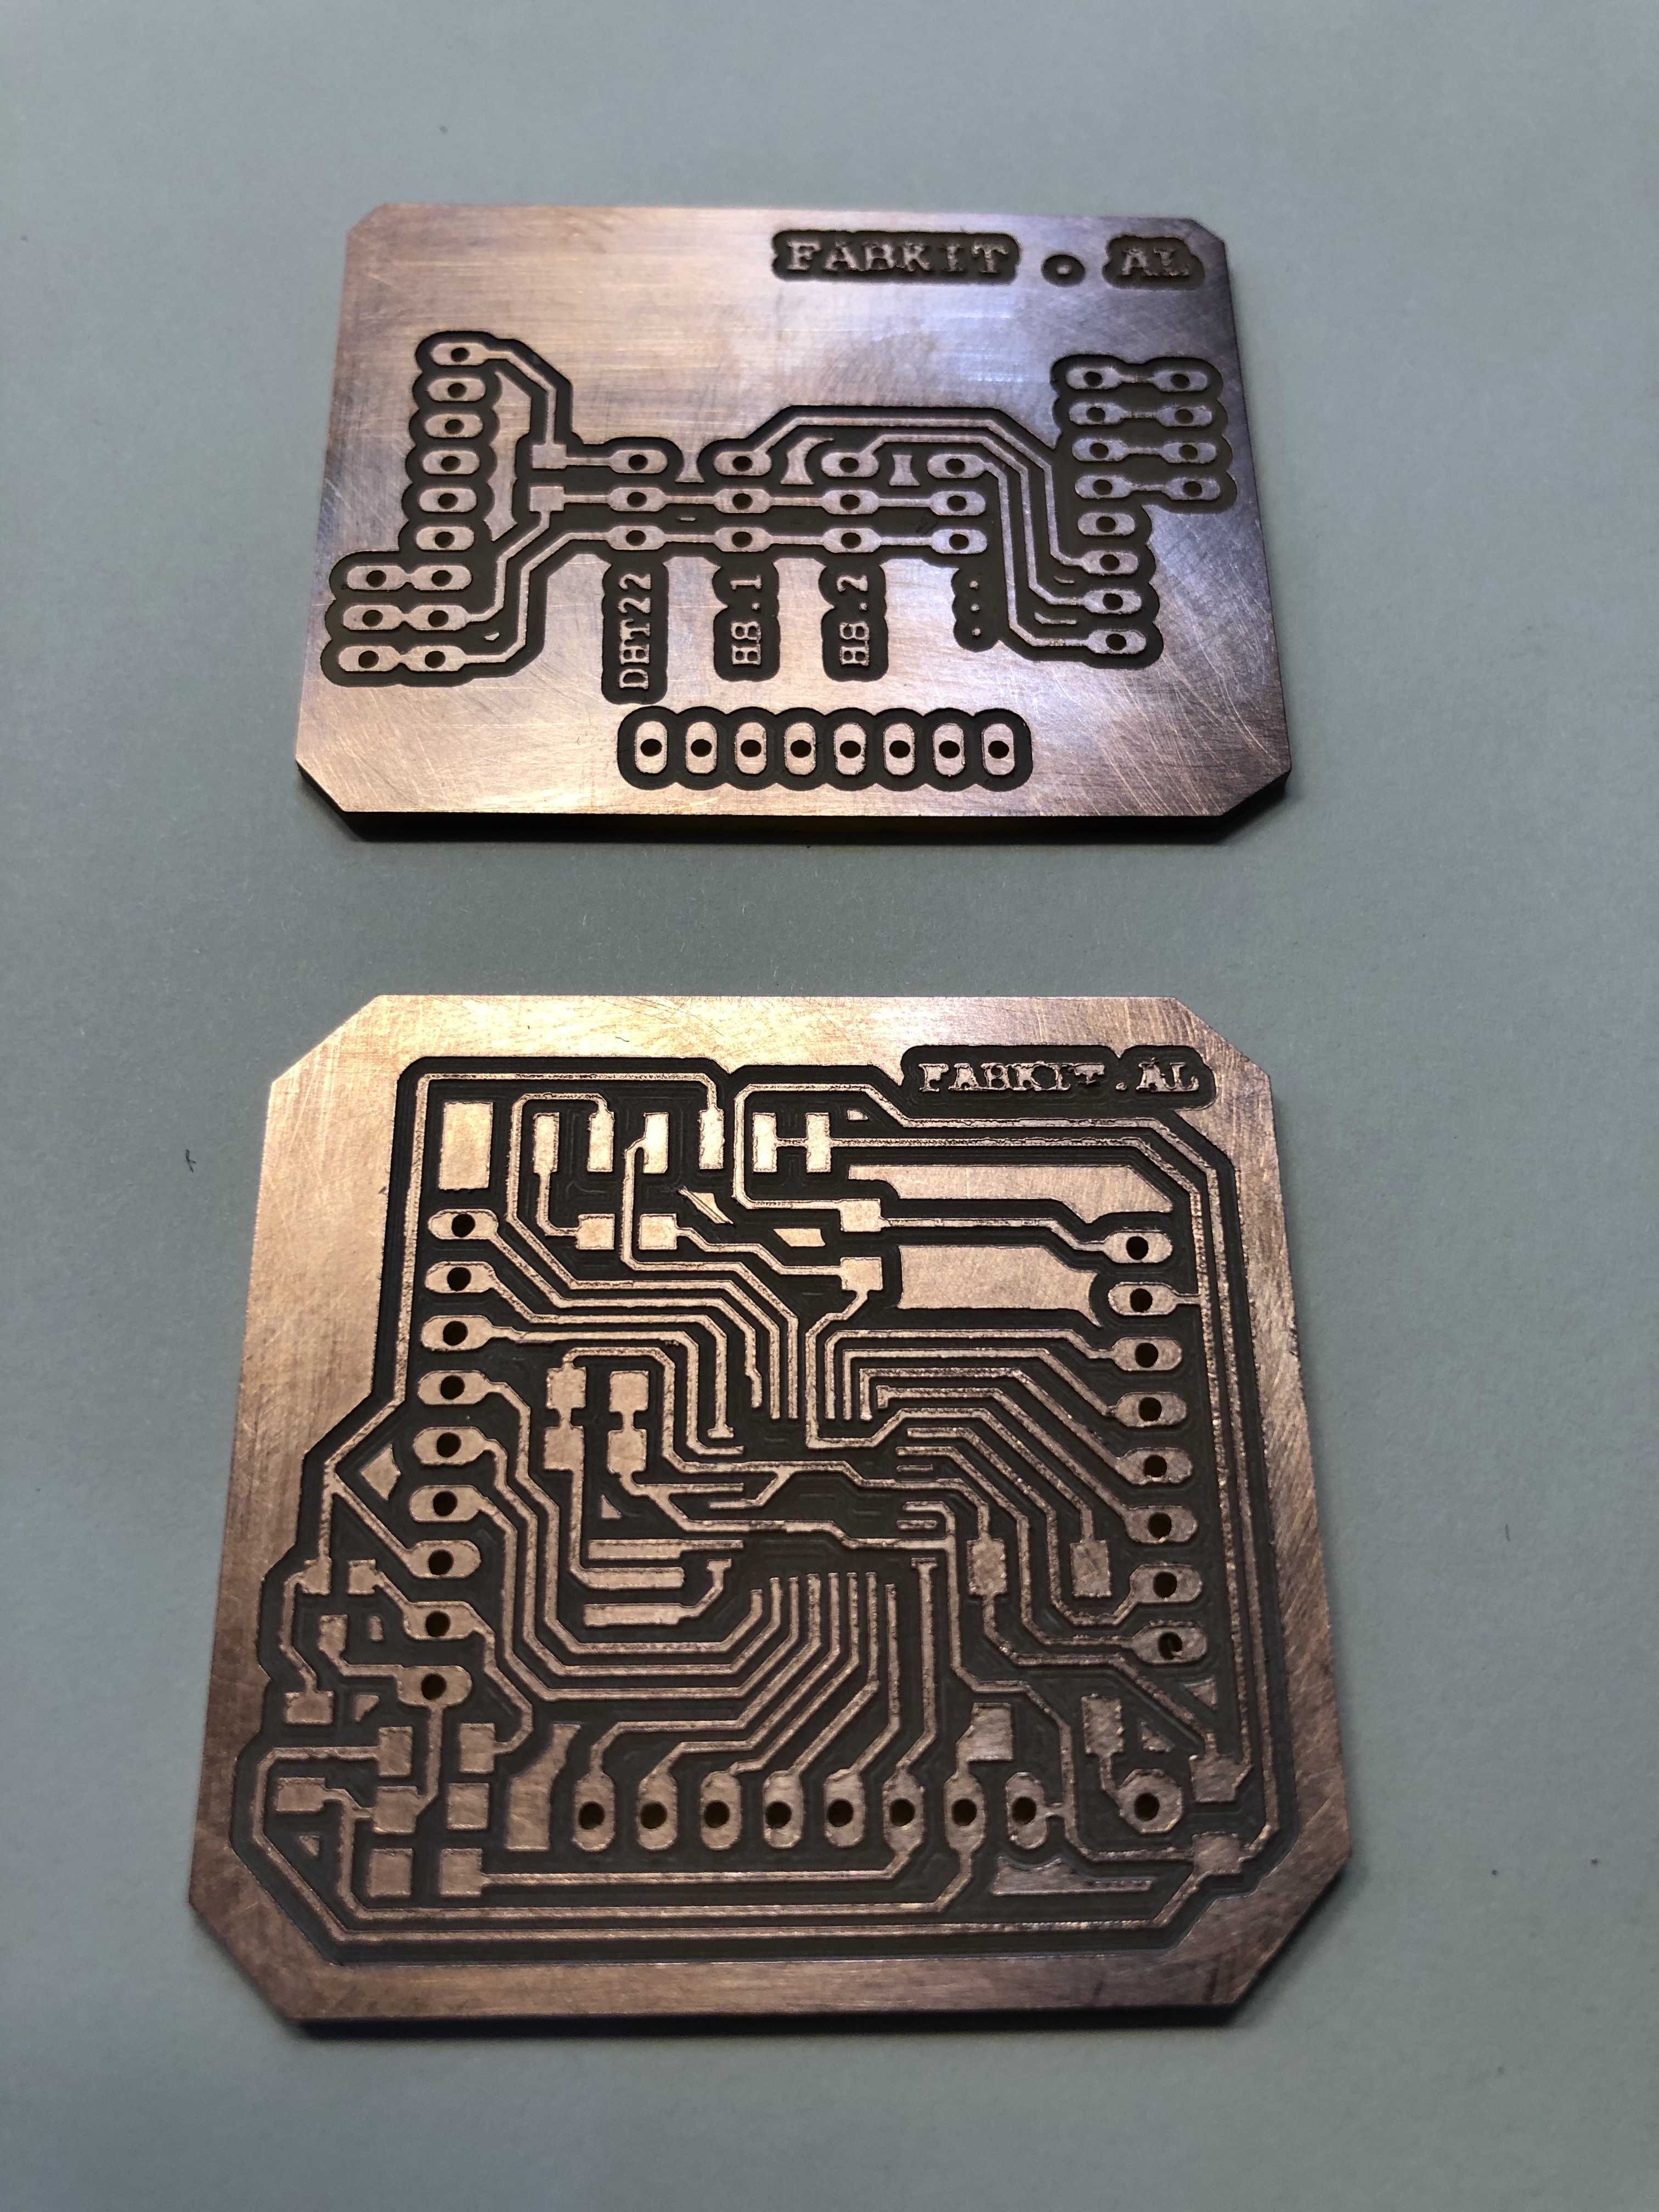
After soldering all the components as I showed on week 11, the board looked like this:
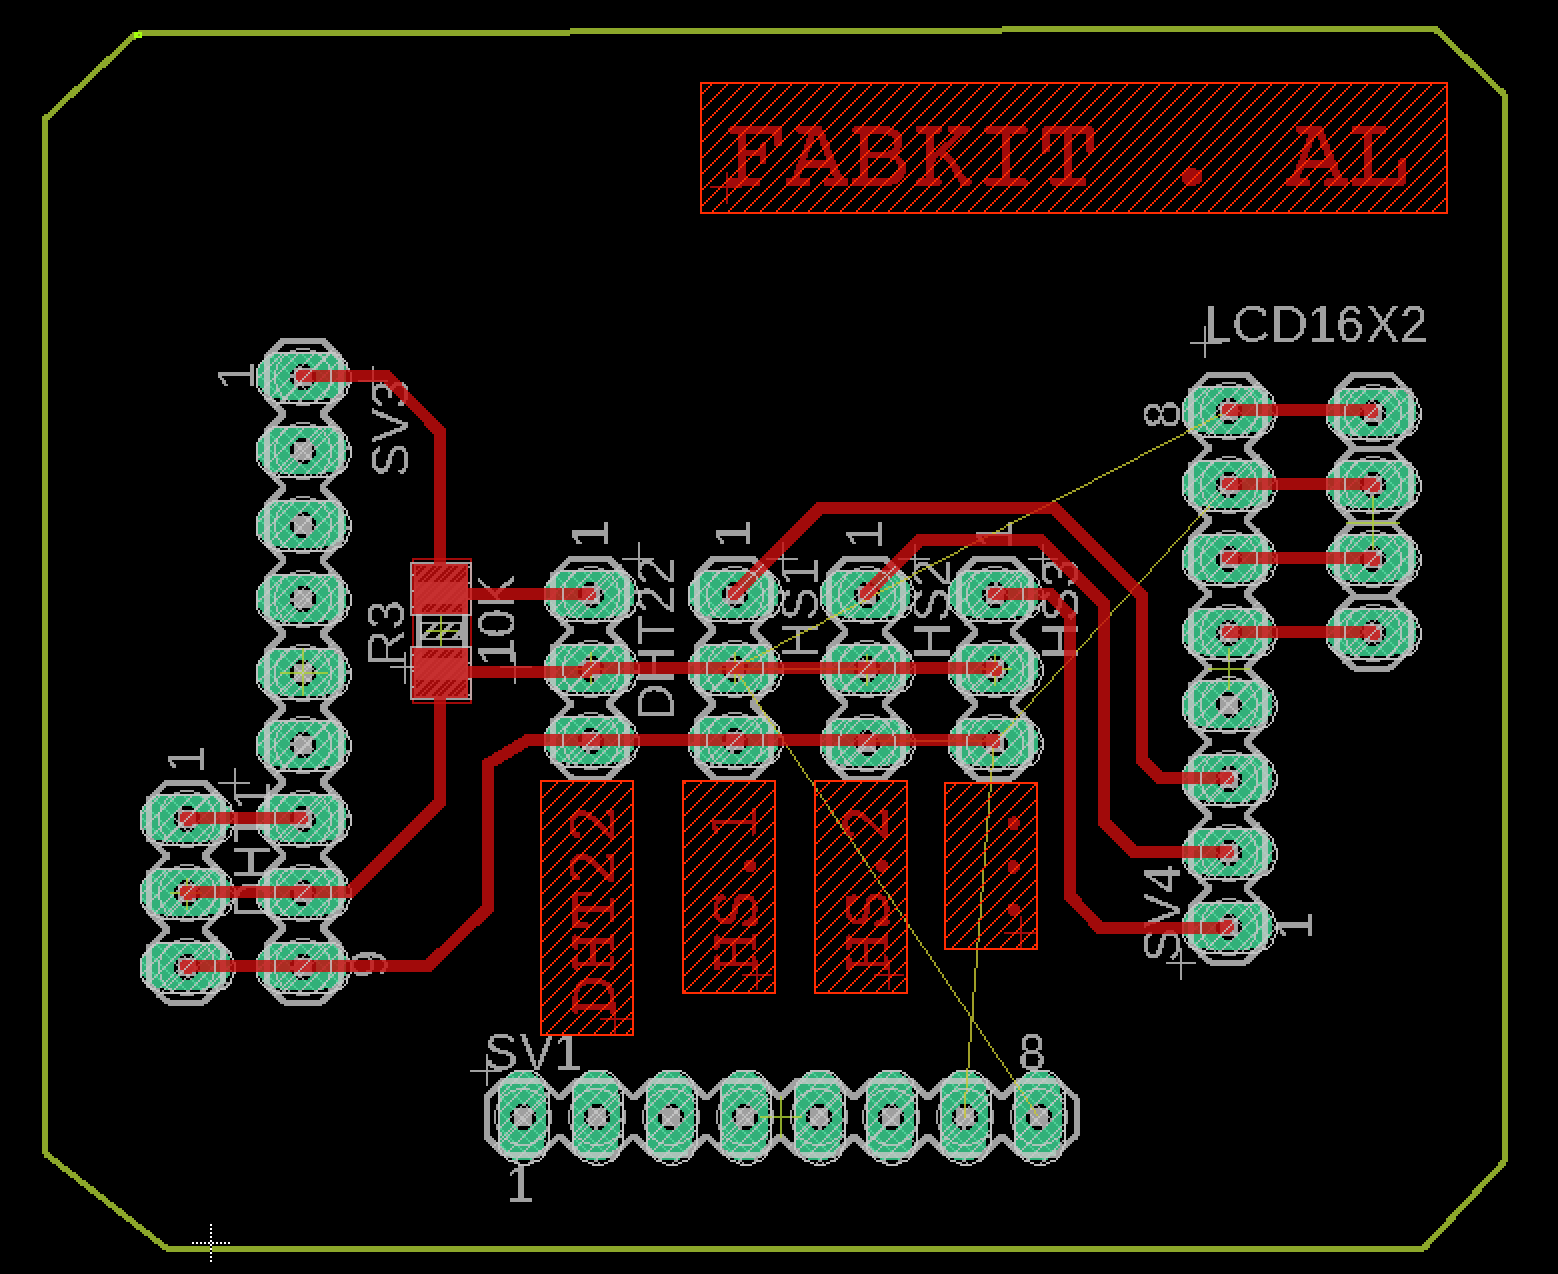
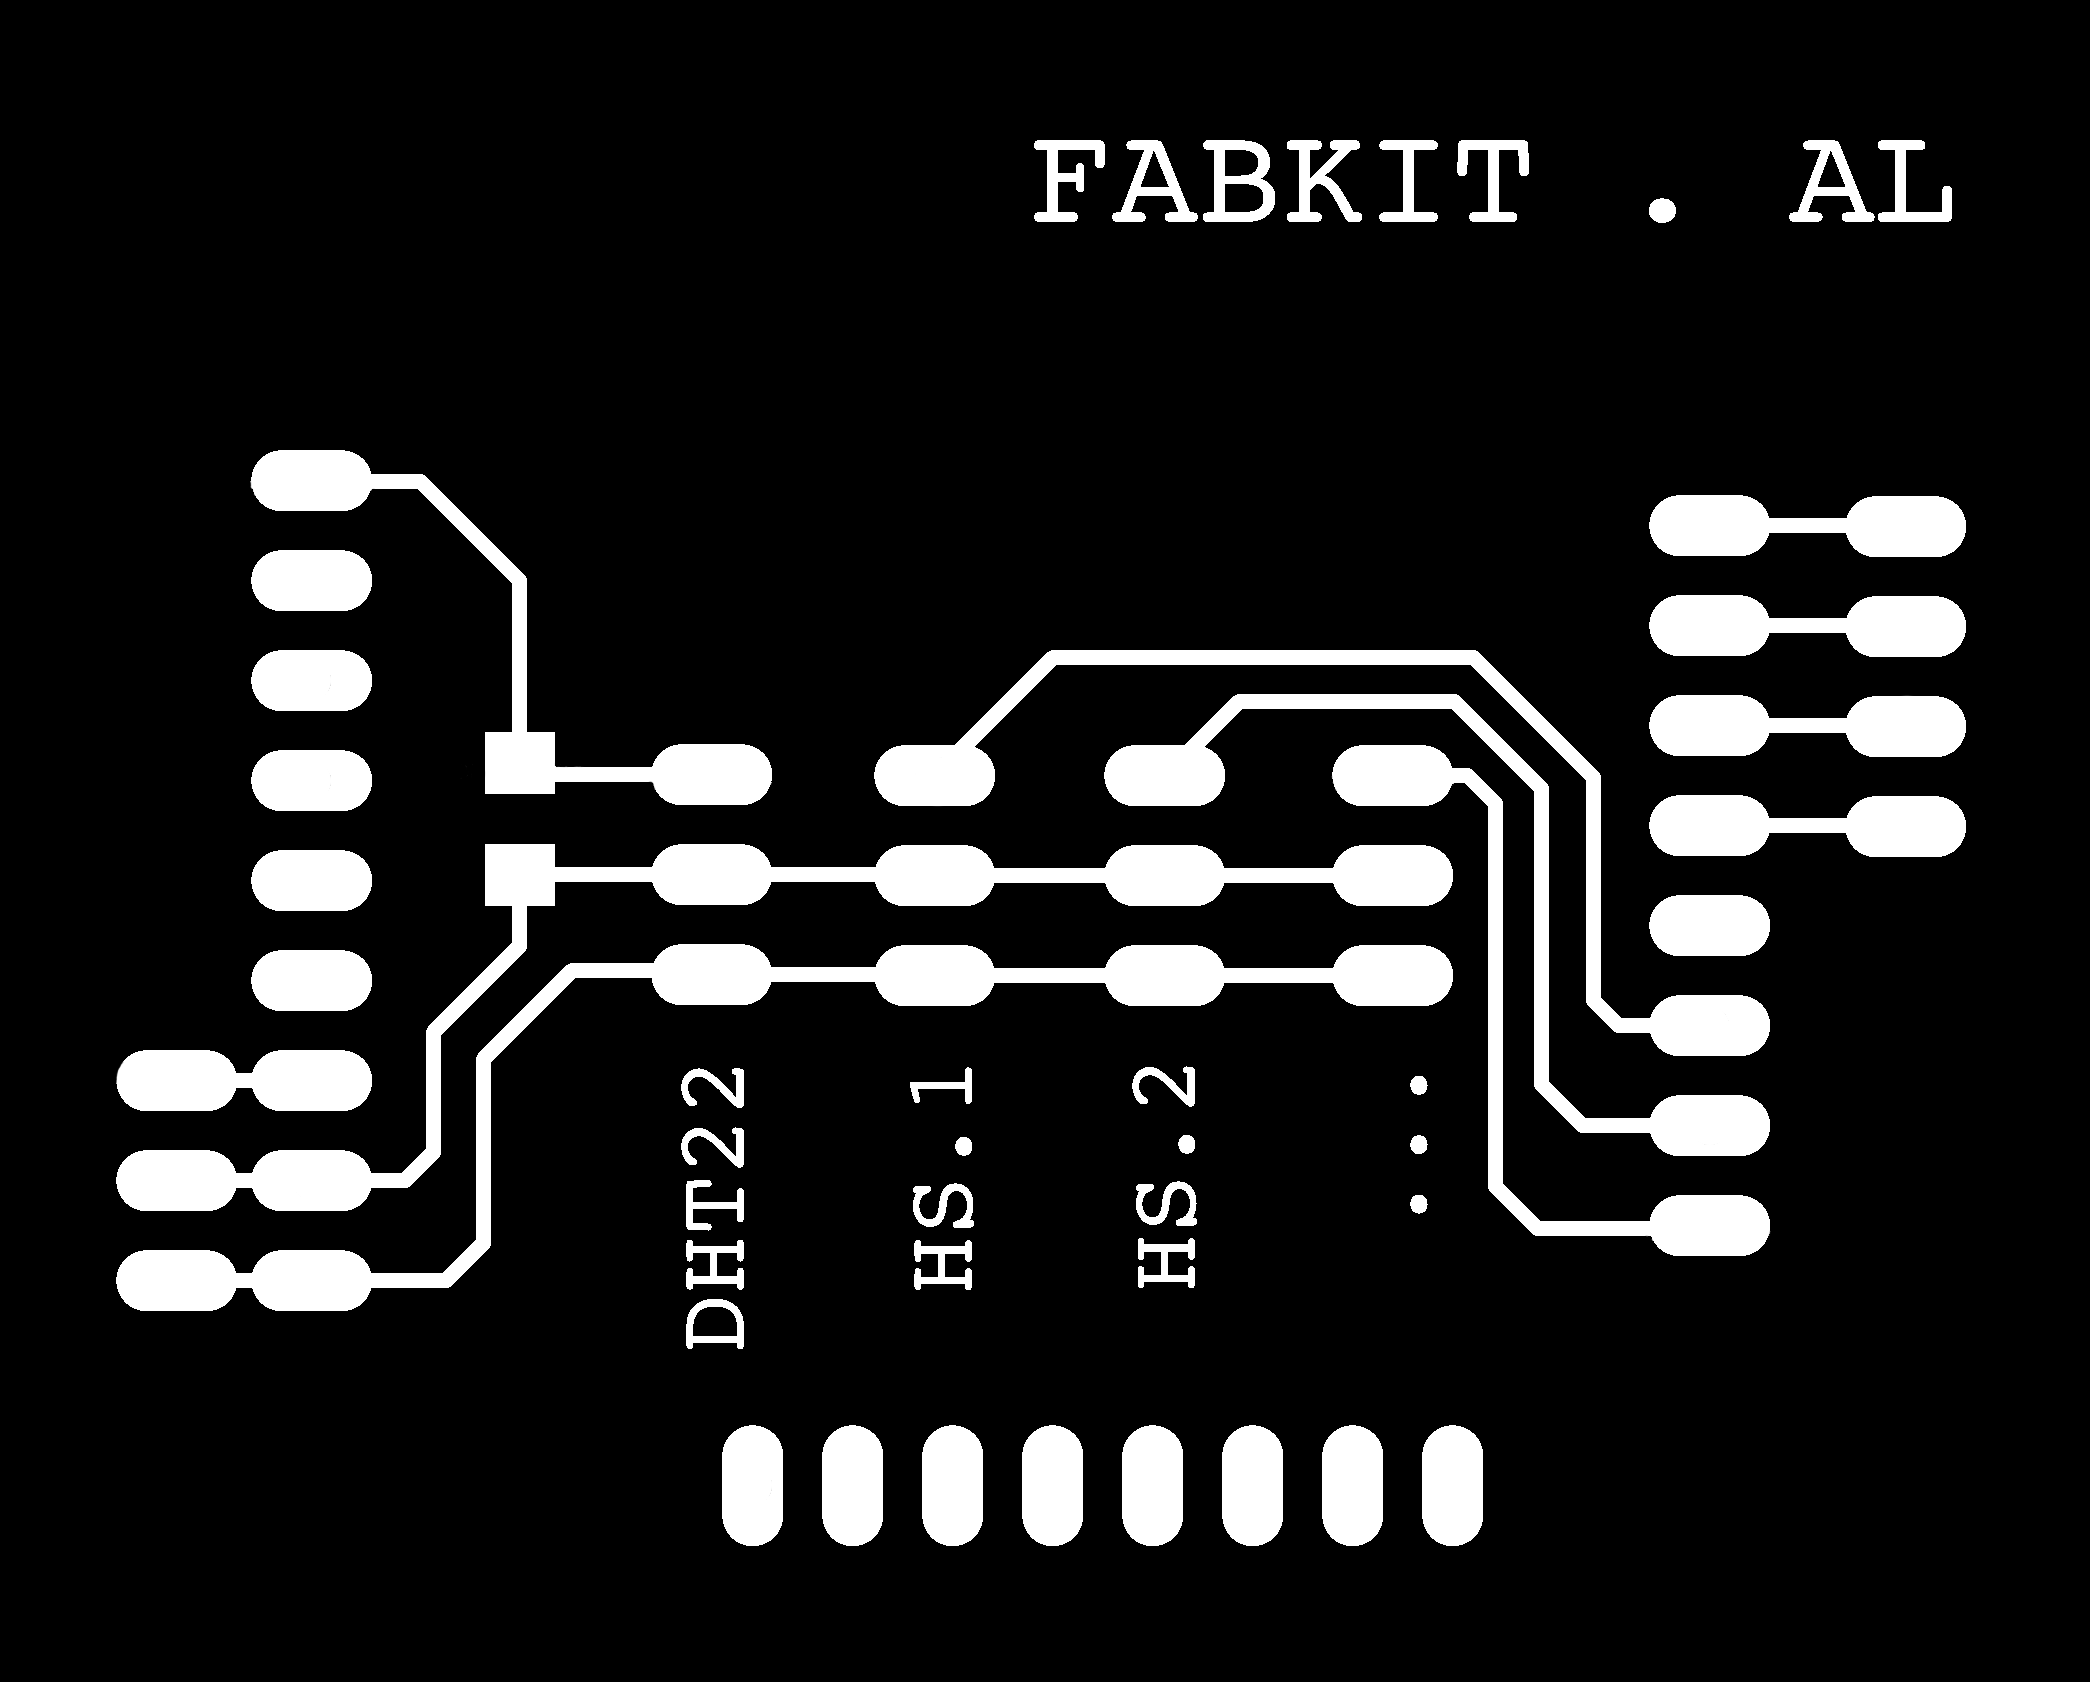
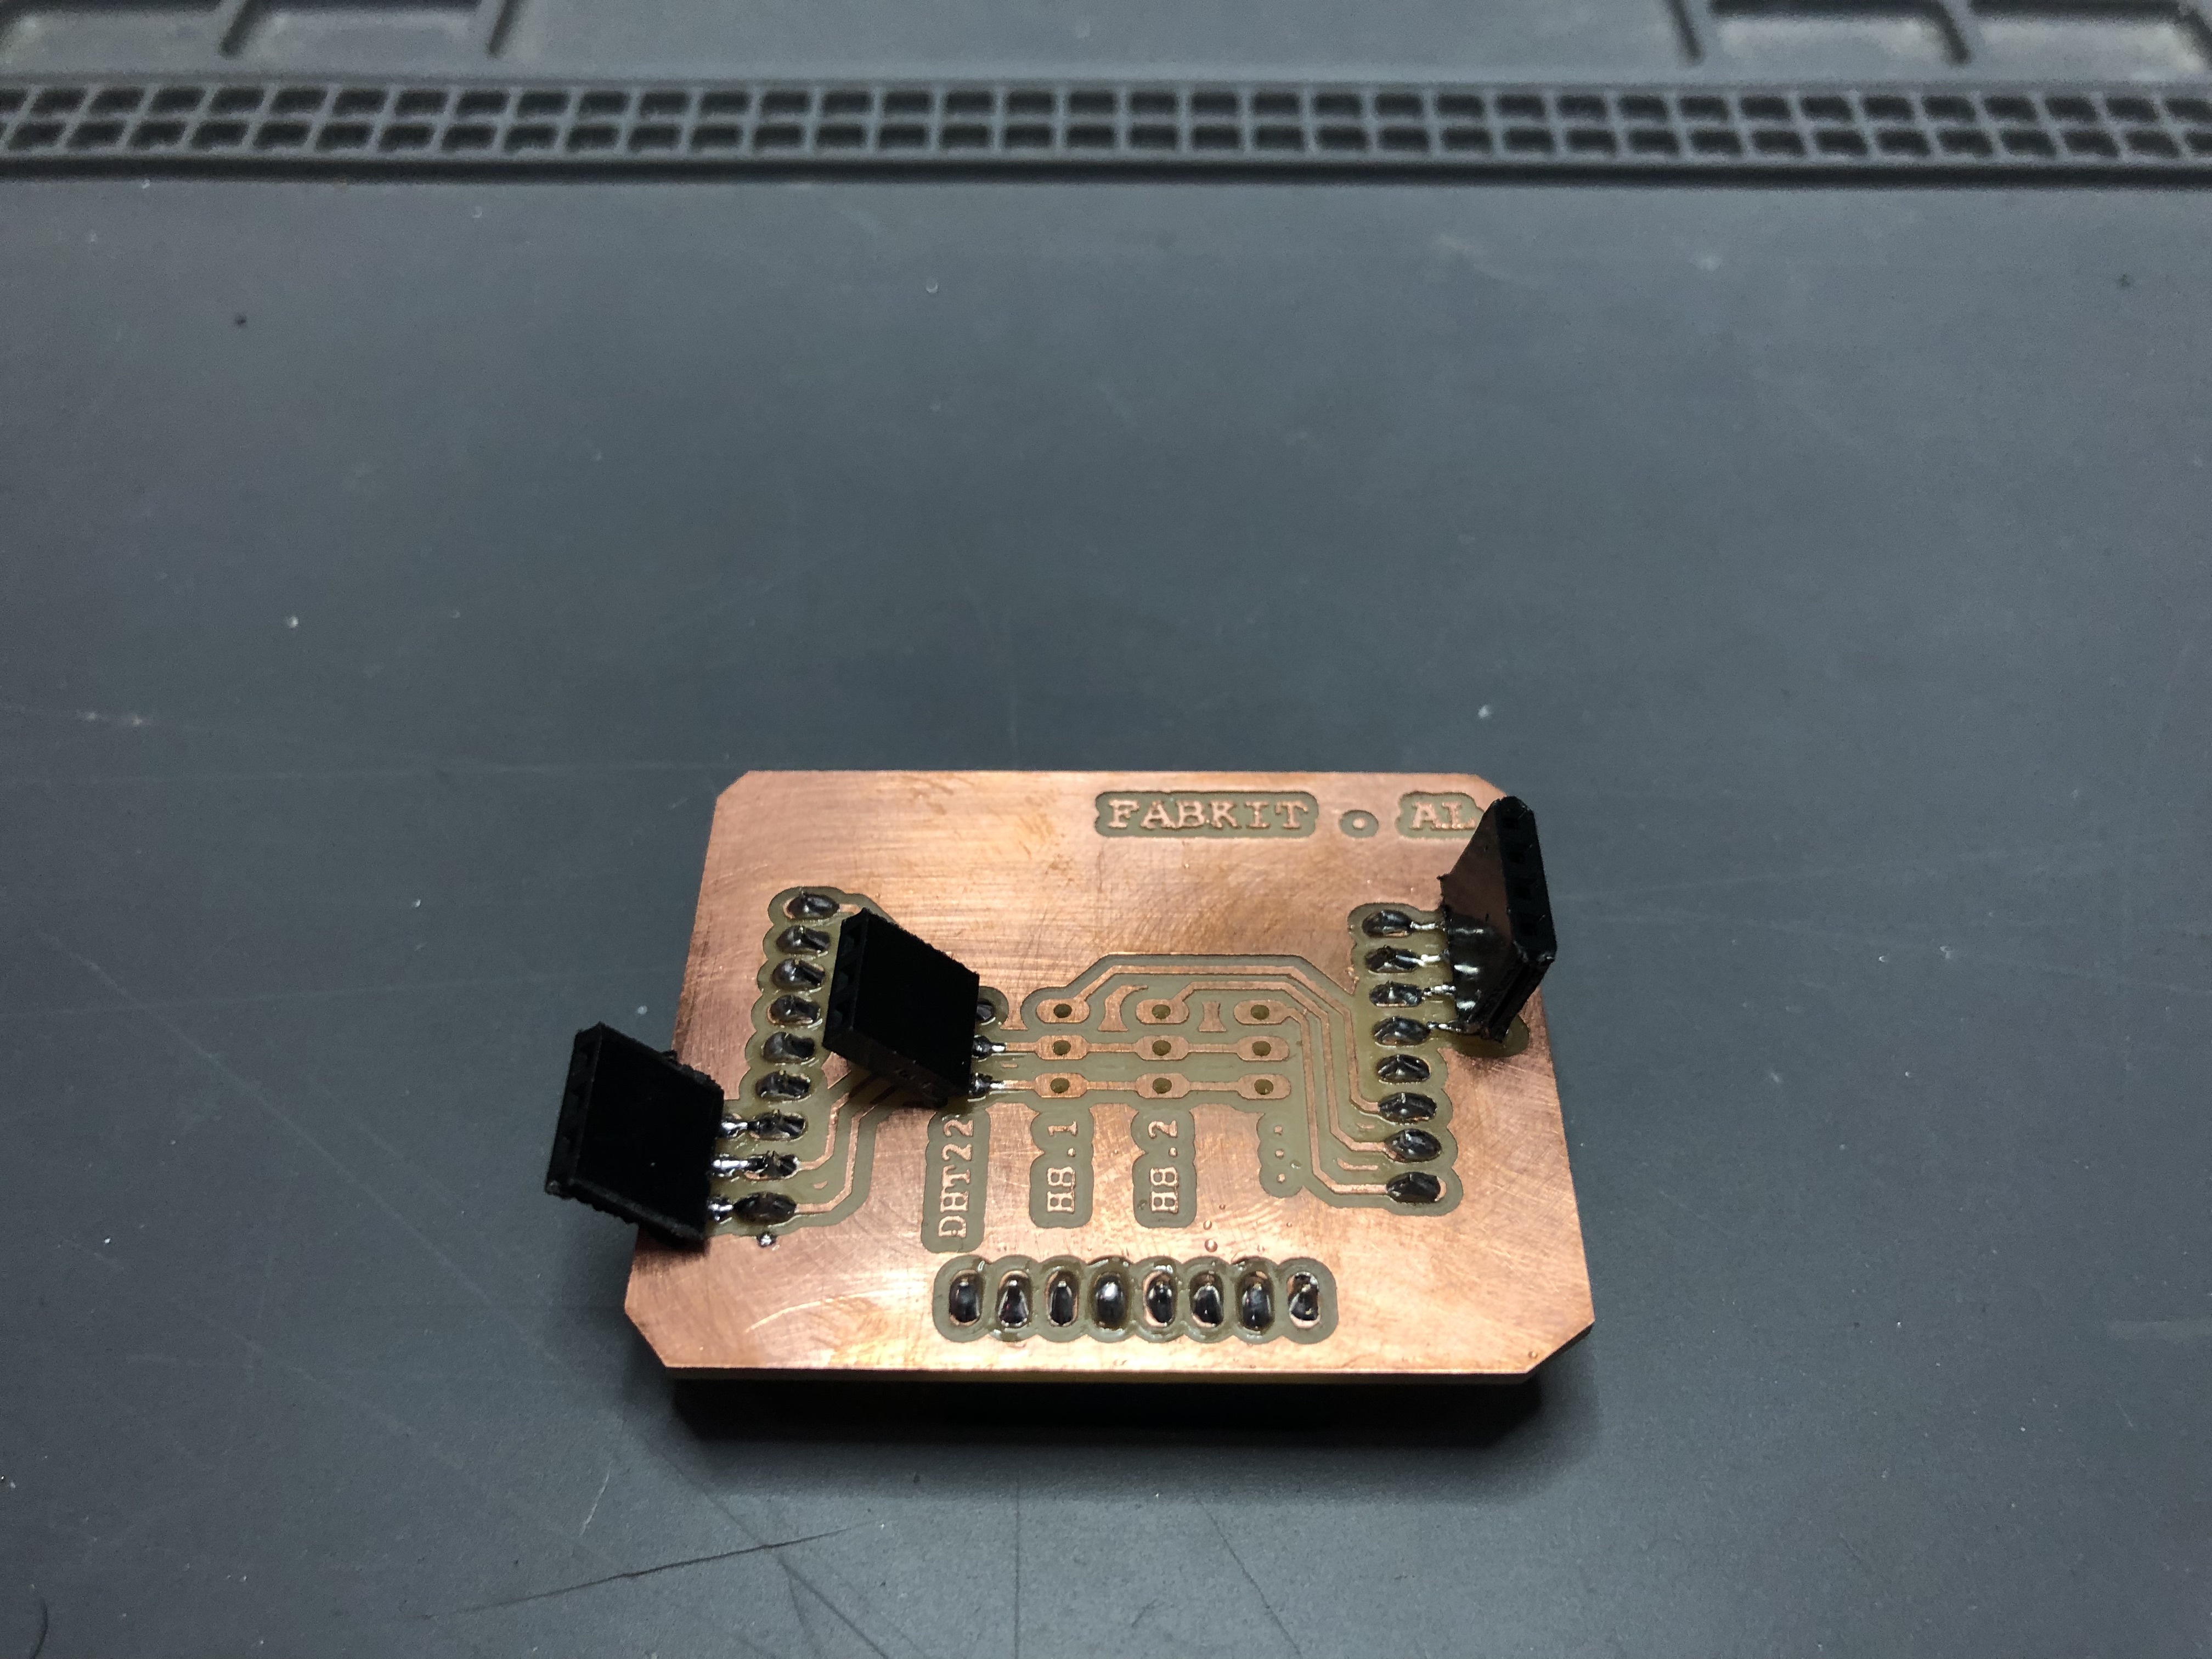
10.2. SENSORS SHIELD production
For the hat sensor shield production I kept the same steps, adding 3 serial pin headers on the lower level to attatch to the board; and 5 on the top to input the sensors and output the extra power and LCD pins:
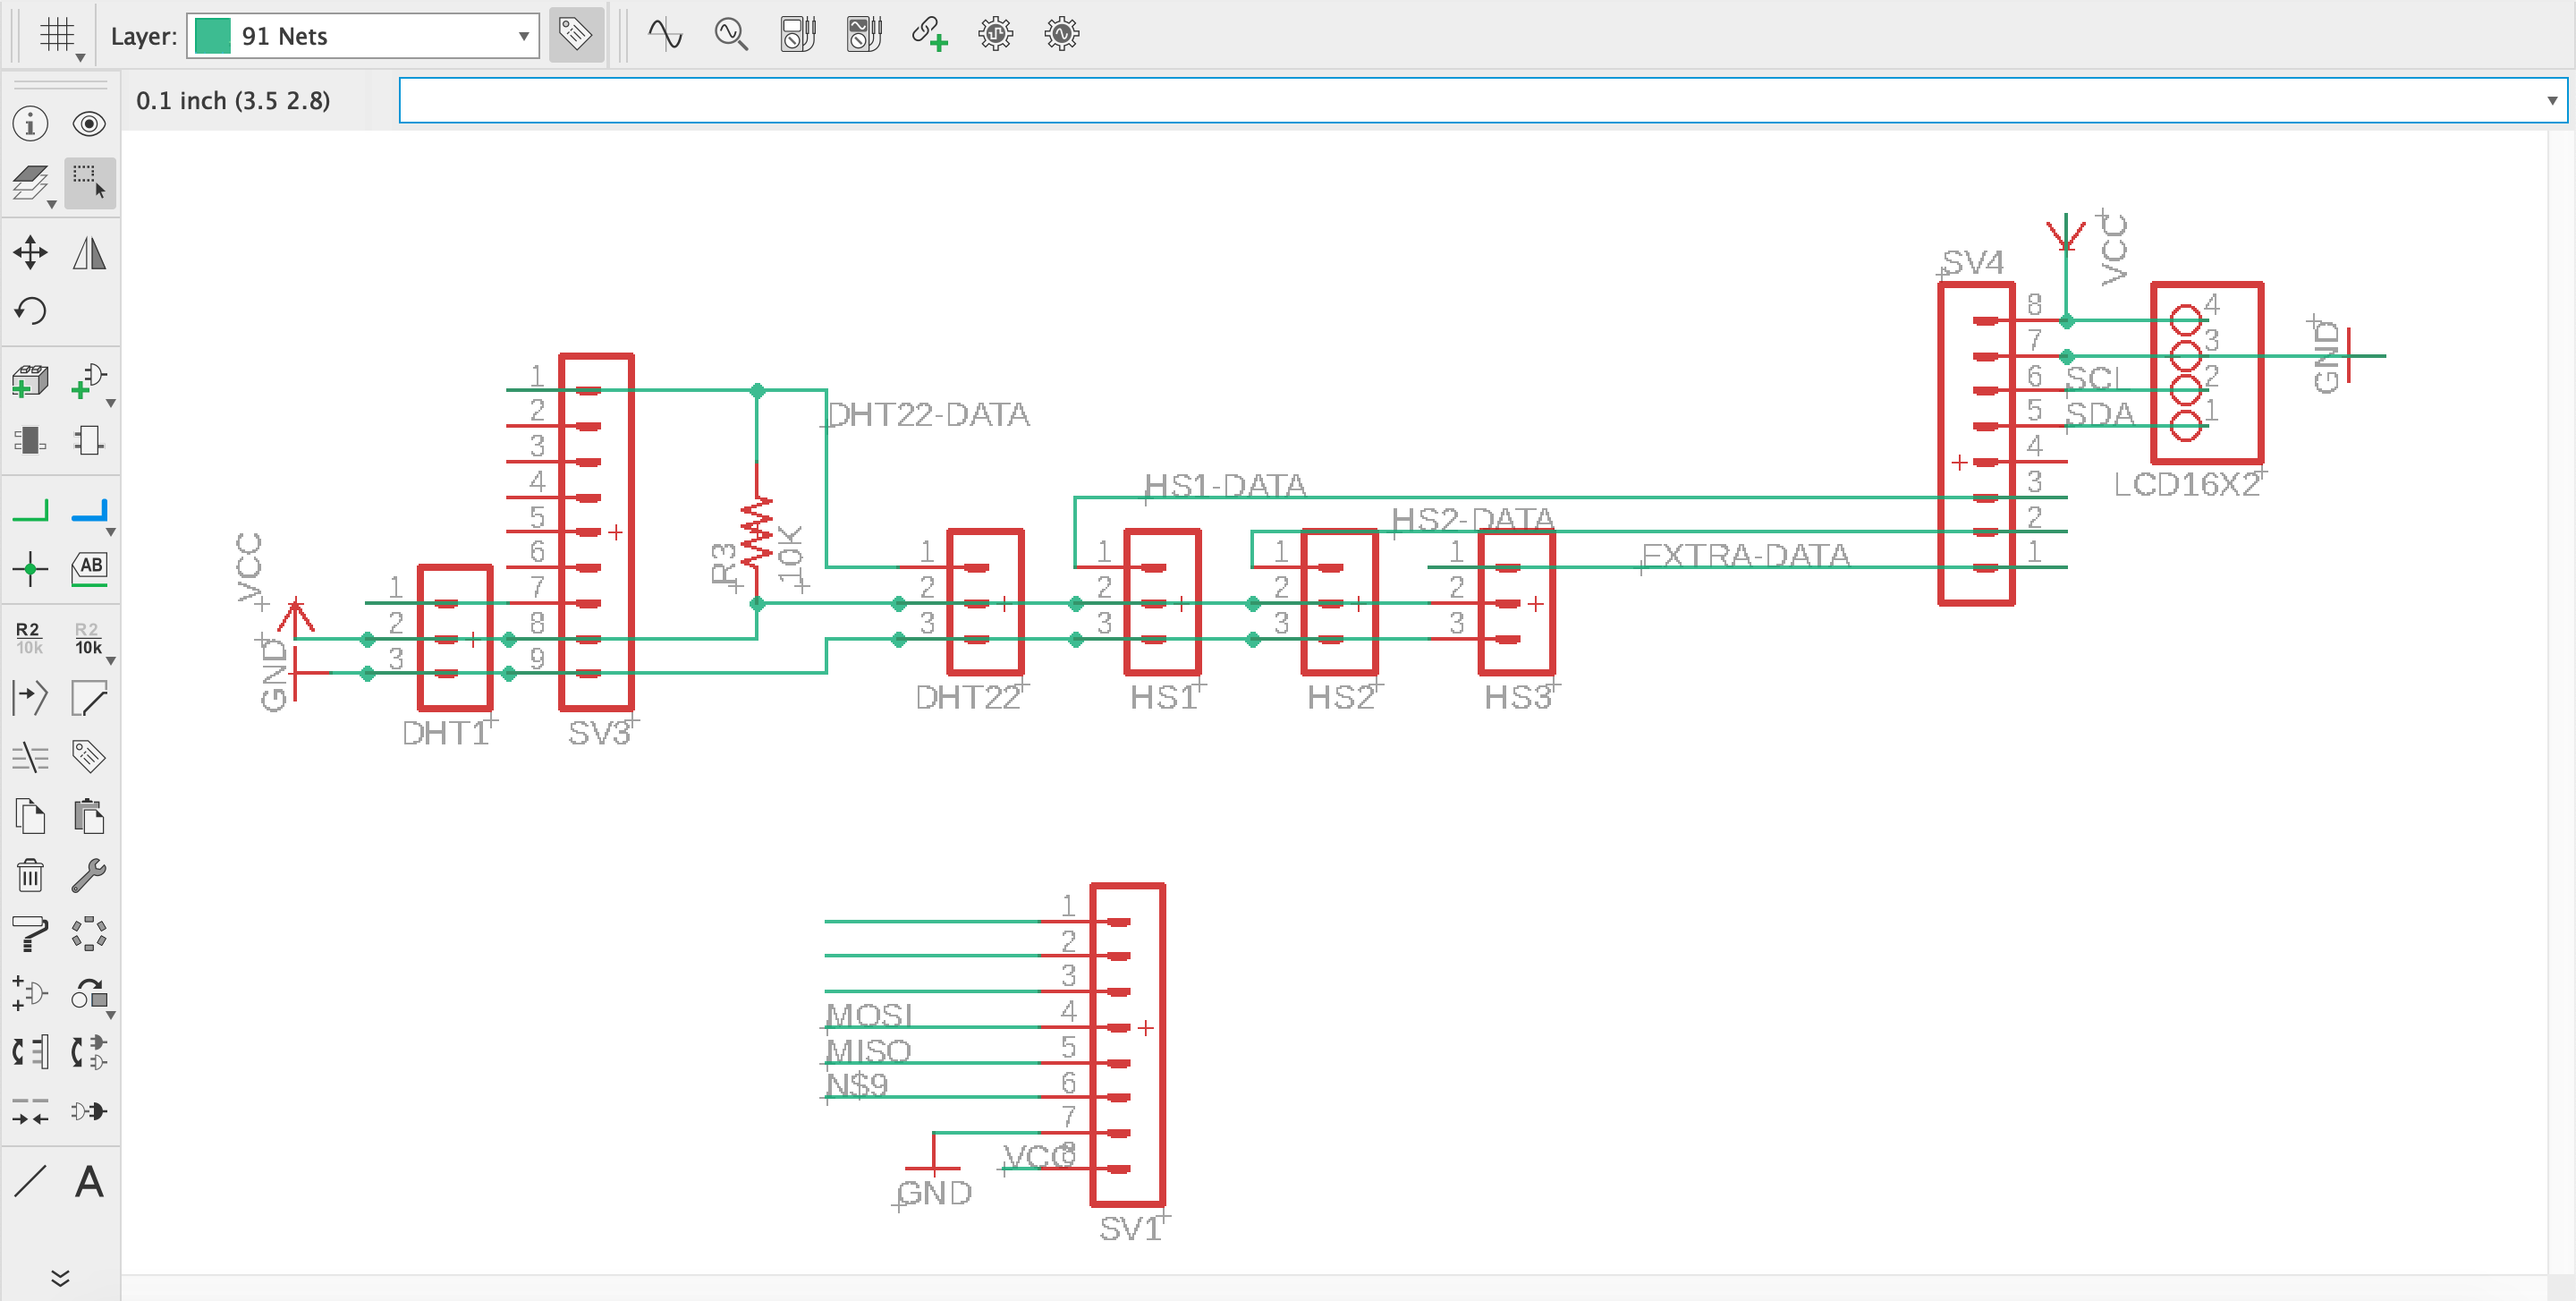
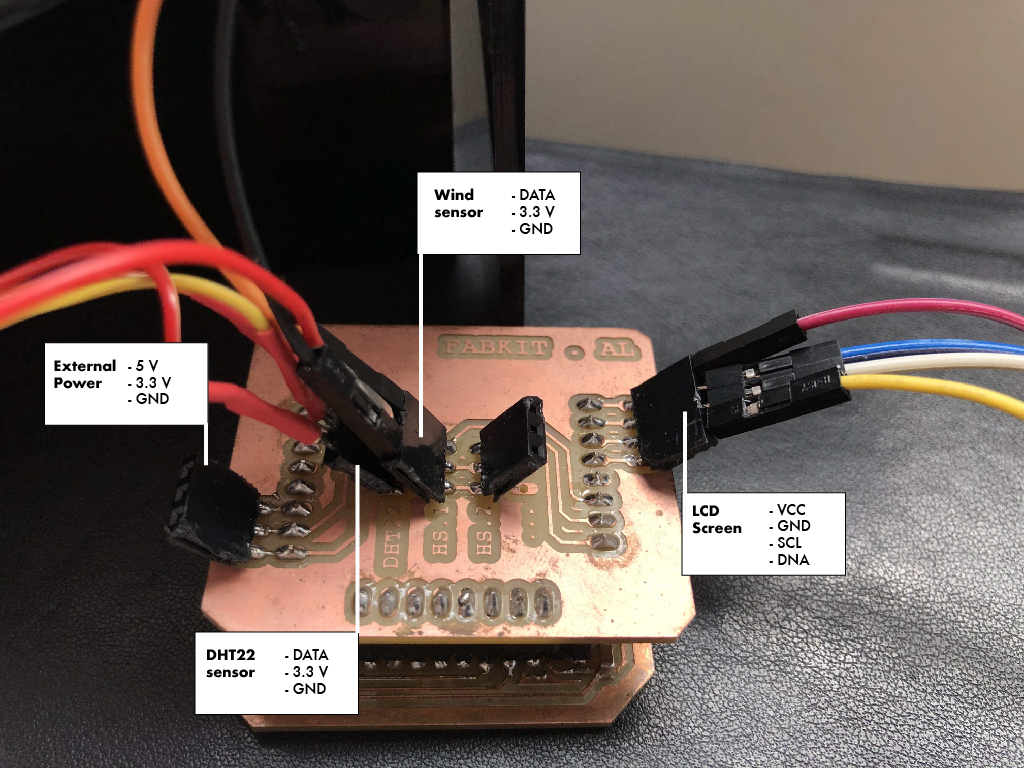
10.3. SYSTEM connections
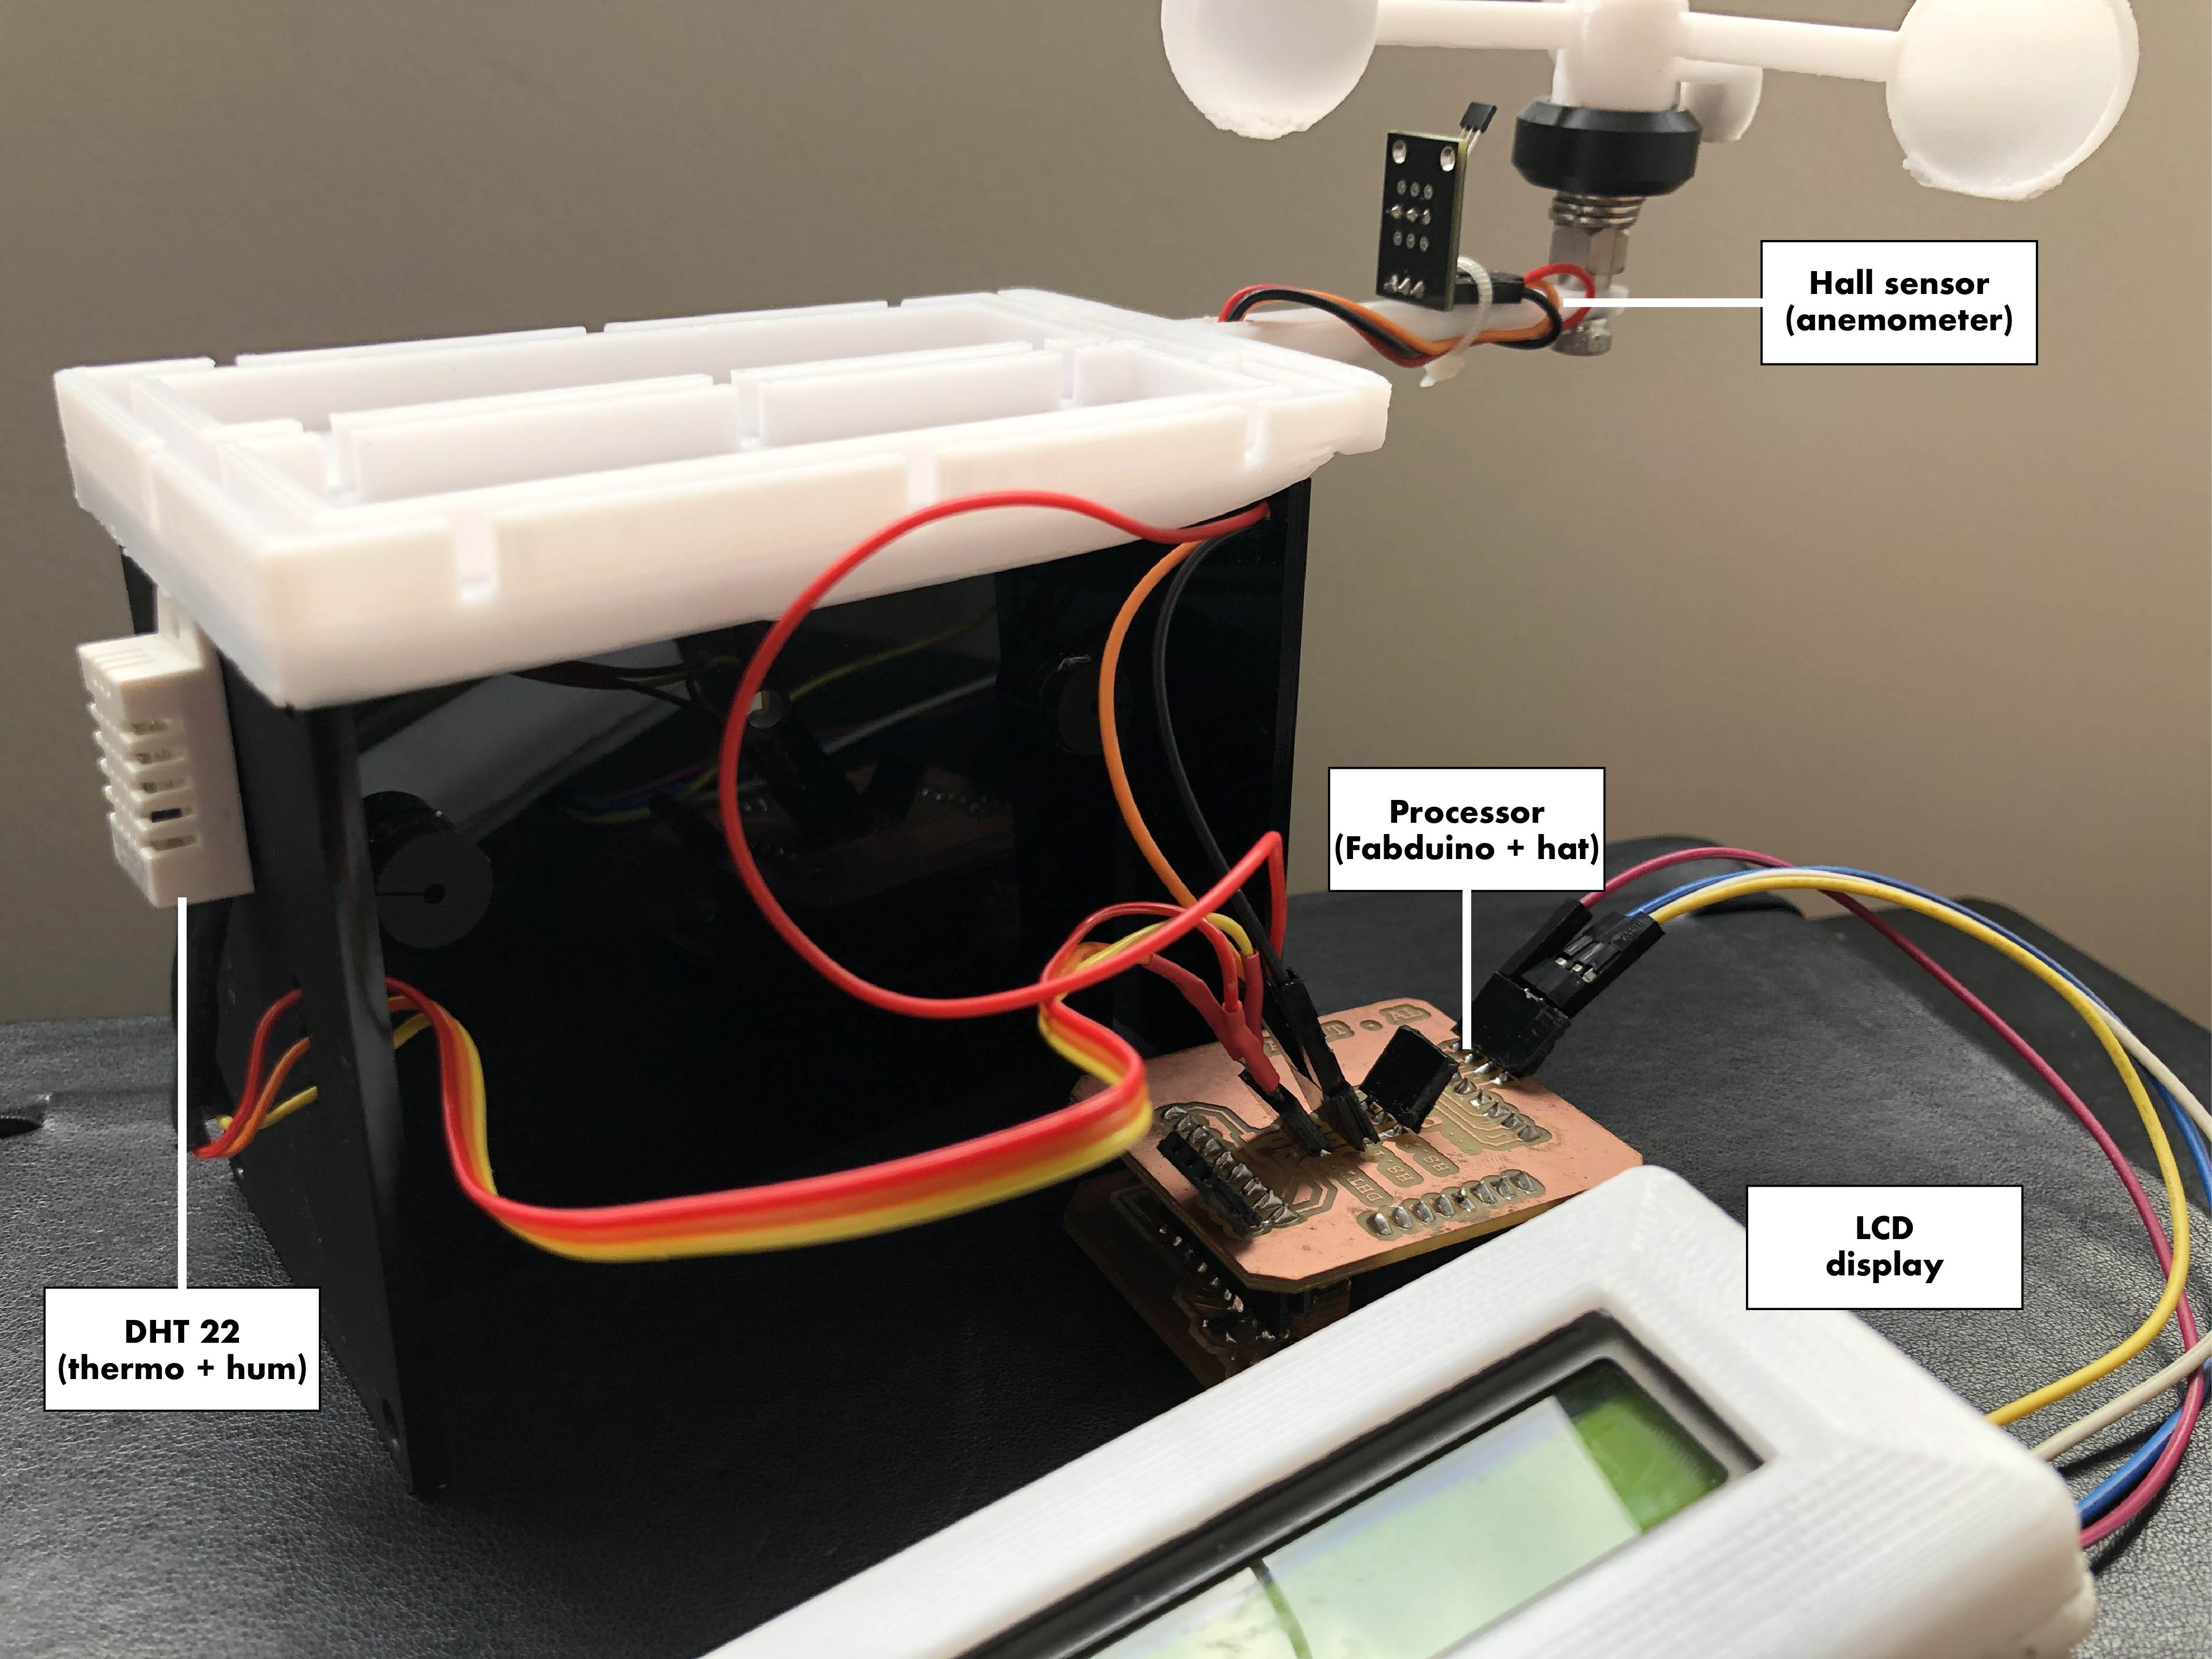
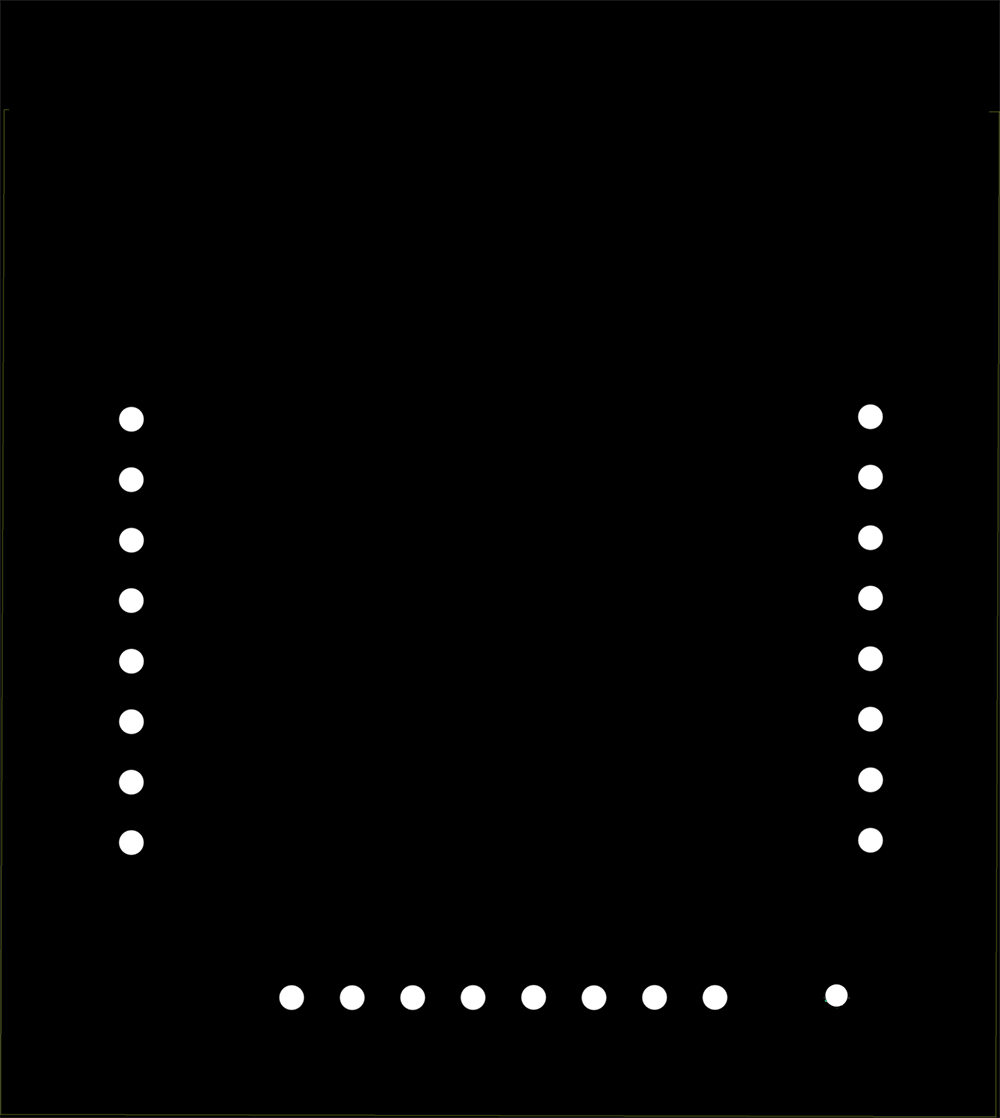
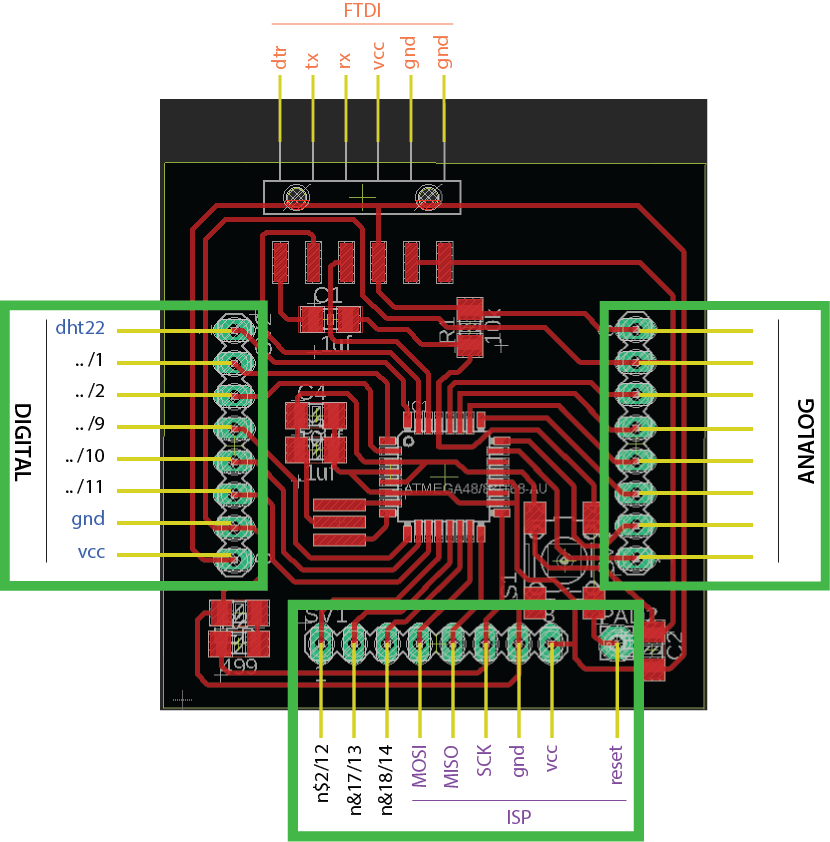
The meteofab's sensoring system is connected to the processor with the following wiring position:
PD.11. Testing sensors
11.1. Testing DHT22 sensor (thermometer + hygrometer)
The temperature and humidity sensor (DHT22) testing is explained on the Input Device assignment.
11.2. Testing Hall Effect sensor (anemometer)
As I explained on Embedded Programming assignment, Hall Effect sensors can be used as interrupts, so that you can activate (red blink on Hall sensor module) or deactivate a function with its magnet propperty opening or closing a circuit.
Therefore, I put a magnet button on the anemometer to spin near the Hall Sensor to count its rotations every second. With the rotations per second I can calculate the linear windspeed in MPH and Km/h.
Here, there is a short video showing how it works and what values I got:
11.3. Programming the board
I used Arduino and my FabISP board to programm the main board as I did in previous assignments.
First I had to include the libraries of the components on the sketch according to the DHT22 sensor, the LCD screen and the I2C comm.
Then I set the constants for the DHT22 and I2C pins, and the variables for humidity and temperature, and anemometer's speed and RPMs.
//Libraries
#include
#include
#include
//Constants
#define DHTPIN 2 // what pin we're connected to
#define DHTTYPE DHT22 // DHT 22 (AM2302)
DHT dht(DHTPIN, DHTTYPE); //// Initialize DHT sensor for normal 16mhz Arduino
long previousMillis = 0; // will store last time LED was updated
long interval = 1000; // interval at which to blink (milliseconds)
long interval2 = 2000;
LiquidCrystal_I2C lcd(0x27,20,4);
//Variables
int chk;
float hum=0; //Stores humidity value
float temp=0; //Stores temperature value
// diameter of anemometer
float radius= 2.75; //inches from center pin to middle of cup
float diameter = radius * 2; //inches from center pin to middle of cup
float mph;
float kmh;
// read RPM
int half_revolutions = 0;
float rpm = 0;
unsigned long lastmillis = 0;
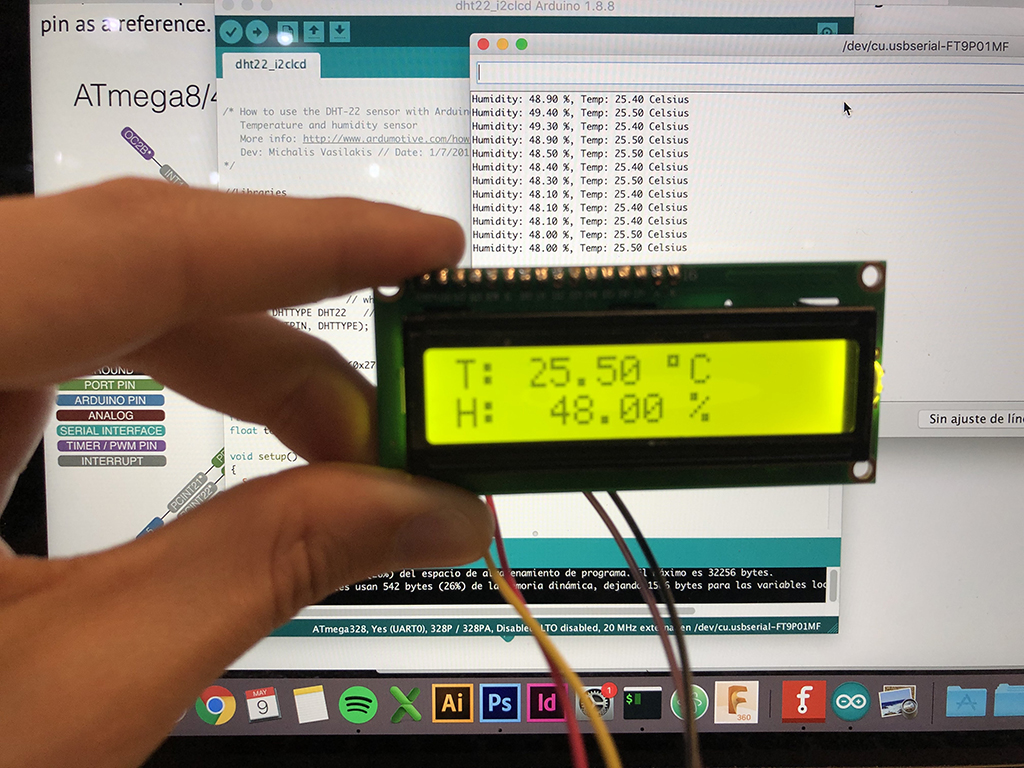
After, I created a loop for every 2 secs, measuring first the number of activations with the hall sensor, and converting the rpms into km/h; and also the data collected by the DHT22 sensor. And finally printing the info on the LCD screen in 2 lines: the first will include the text "Humidity: " + the (hum) variable + "%" - and on the second line the temperature data displaying "Temp: " + (temp) variable + and "C" for celsius degrees.
After 2 secs, the LCD will be cleared and will display the anemometer data: first line "Actual WindSpeed" and on the second line, (kmh) variable + "Km/h".
void setup()
{
Serial.begin(115200);
dht.begin();
lcd.init();
lcd.setBacklight(HIGH);
pinMode(DHTPIN, INPUT_PULLUP);
attachInterrupt(A0, rpm_fan, FALLING);
}
void loop()
{
//Read data and store it to variables hum and temp
unsigned long currentMillis = millis();
if(currentMillis - previousMillis > interval) {
if(currentMillis - previousMillis > interval2) {
// save the last time you blinked the LED
previousMillis = currentMillis;
detachInterrupt(A0);//Disable interrupt when calculating
rpm = half_revolutions * 30; // Convert frequency to RPM, note: 60 works for one interruption per full rotation. For two interrupts per full rotation use half_revolutions * 30.
// Serial.print("RPM =t"); //print the word "RPM" and tab.
// Serial.print(rpm); // print the rpm value.
//Serial.print("t Hz=t"); //print the word "Hz".
// Serial.print(half_revolutions/2); //print revolutions per second or Hz. And print new line or enter. divide by 2 if 2 interrupts per revolution
attachInterrupt(A0, rpm_fan, FALLING); //enable interrupt
mph = diameter * 3.14 * rpm * 60 / 63360;
//mph = mph * 3.5; // calibration factor for anemometer accuracy, adjust as necessary
kmh = mph * 1.60934;
lcd.clear();
lcd.setCursor(0,0);
lcd.print("Actual WindSpeed");
lcd.setCursor(0,1);
lcd.print(kmh);
lcd.print(" Km/h");
Serial.println(kmh);
Serial.println(" Wind");
half_revolutions = 0; // Restart the RPM counter
} else{
hum = dht.readHumidity();
temp = dht.readTemperature();
//Print temp and humidity values to serial monitor
Serial.println("Humidity: ");
Serial.println(hum);
Serial.println(" %, Temp: ");
Serial.println(temp);
Serial.println(" Celsius");
lcd.clear();
lcd.setCursor(0,0);
lcd.print(temp);
lcd.print((char)223);
lcd.print("C ");
lcd.setCursor(0,1);
lcd.print(hum);
lcd.print(" %");
}
}
}
void rpm_fan(){
half_revolutions++;
}
11.4. Testing the board
This is the first testing I made on week11 to output the data received by the humidity-temperature sensor on the LCD screen:
PD.12. Project slide
PD.13. Project video
PD.14. Invention, intellectual property and income
As I explained on Wk19. Invention, intellectual property and income

This work is licensed under a Creative Commons Attribution-NonCommercial-ShareAlike 4.0 International License.
PD.15. Conclusion and Future developments
In general terms I enjoyed quite much this project as I worked several processes to come up with a functional device. But I would also like to develop the project in other fields.
As future improvements or further steps about my project, there are some aspects I would like to remark. The data collected by the system for example could be stored in a removable miniSD card, or sent via a low-power wide-area network called LoRa (reaching distances up to 10km in rates below 50kbps), or developing a WiFi or Bluetooth module to improve the serial connection and communicate with most smart devices to output or store the data.
After storing the data, it would be great to process the info to obtain average data, maximum and minimum rates and show them in simple graphs. So this could also include an interface that I could develop on Processing.
Here there are some questions I would like to fulfill deeper about the project:
- What tasks have been completed, and what tasks remain?
In terms of system's concept development and general feasibility, I guess I got most of the production goals achieved. I enjoyed working with different tools, materials and fabrication processes, keeping in mind the diy simplicity to reach most of the accessible ways of making it.
About the electronics and its processor's final result, I'm glad to have redesigned an opensource item but I would like it to be more open and adapted to the needs of the device, specially in case we wanted to add other different gadgets and tools.
But the biggest point to go through in a future is its communication field, as in this case, the way to represent and send the data obtained by the device got too short within the several data sending services as I said before.
- What has worked and what hasn't?
Thinking specifically about its functional use, I just got right data from 2 out of the 3 kind of sensors to work with, this means the temperature/humidity sensor and the anemometer. In the case of the pluviometer I got short to make accurate measurements of the dropping system and obtain real data from it. So this should be a must to get in the future.
- What questions need to be resolved?
There are several aspects that should be faced as:
- Will this device work in strong environmental conditions?
- Is this device completely autonomous? Could it be powered with a solar battery? Can we define its working time along the day?
- Could we change the case's 3d printing process and use recyled plastic molds to make the solid pieces?
- Would it make sense to adapt the device to mobile devices such as drones, trucks or bikes to get different data from different spots in an studied route?
- How could we put this device into academic fields, talking about producing or measuring lines?
- What will happen when?
As long as I try different versions of the device I would make the changes about design or gadgets. This process needs to be a cycling test to try the improvements and weakens that come along the work. But I specially would like to put it in practice in different communities and also looking forward a crowdfunding or collaborative work to go deeper and faster along the whole process.
- What have you learned?
A part from all the techniques that I had almost no experience at all, or that I almost forgot these last years (communications, electronics production, processor programming, molding, etc); I got a wider perspective along a product design process.
Back in time I was used to work from the ideation phase till the prototyping end of the process, but this time I had to add new elements that made me work straight to the main goals and forget more formal aspects of the project, which I liked.
Bearing in mind its software needs and other defining goals, I learned to be pragmatic on the project and reject some idealistic proposals to get to the point.
Moreover, this device has become the most functional and 'real' work I got as a prototype, and this fosters my aims to work over it and make something better everytime.