3D Print and Scan.
Concept: 3D Print.
The aim of this lesson is to print a three dimensional object by using 3D printer. The process of 3D printing involves extruding material, usually either PLA
For the object use case, I decided to recreate a geographical area, more specifically the are that encloses the
Some research proved that because of mountain's fame, it was previously recreated several times, and 3D files of this geographical placement were available online in a variety of shapes, however simply downloading the g-code files would make it too easy. I decided to go through all the steps of creating such an object, to be able
The motivation behind printing with different colors came from observing the previously produced models in the lab, while in search for inspiration. They all were extruded using one color, which triggered my curiosity as if could one include a different color in the same print, since another color could give more meaning to the object, a visual touch which would embed in itself an information in some way or another. In the instance of a geographical model, this would enable communicating the viewer with altitude level that is usually communicated using a topographical map.
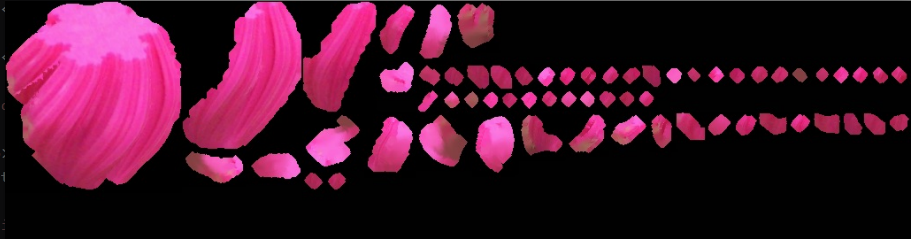
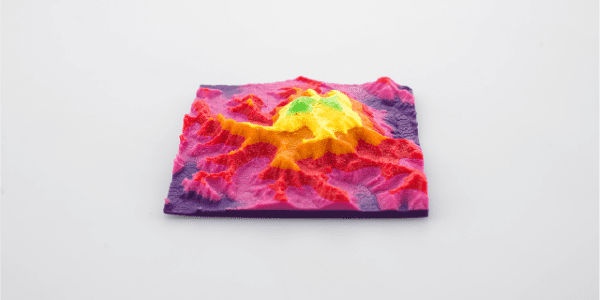
After some research, it proved that in order to print with multiple colors, one would simply require a multiple extrusion printer, availability of which was lacking in our current FabLab. However, using some tweaking, one could simply apply one color extrusion printer and pause at necessary levels in order to exchange extrusion material, eventually obtaining a multiple layer print. In this case, it would enable the geographical object, in this instance the "Everest Mountain", to distinguish using different colors a change in altitude. However, the limitation for this procedure is that one could obtain a change of color at different level only, thus printing a batch of layers in one color at a time. Nevertheless, this procedure suited my initial concept. Here is a demonstration of what a geographical model could look like, while printed using a printer with multiple color extrusions.
Since extracting geographical data that was previously mapped using
Previous instructable will be partly covered in this documentation, as this one is tailored to reach the scope of this project. To get any specific details or missing instructions, please access to following instructable made by drhatch.
Extracting Geographical Data
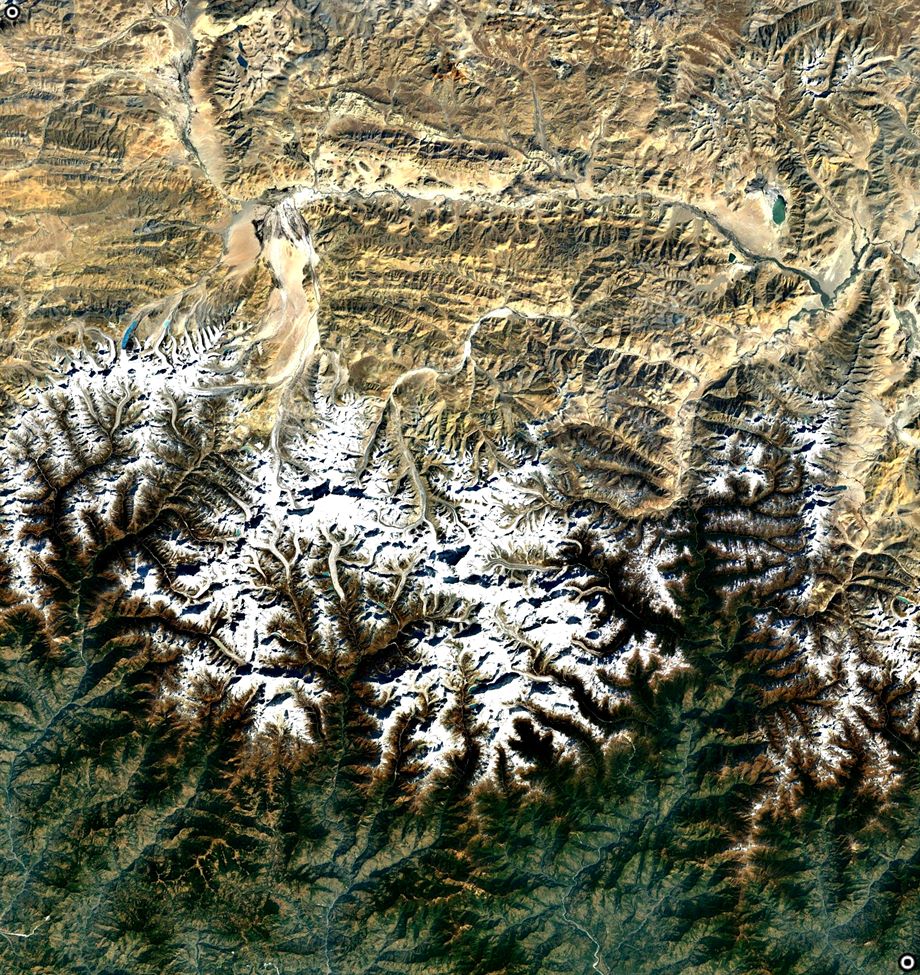
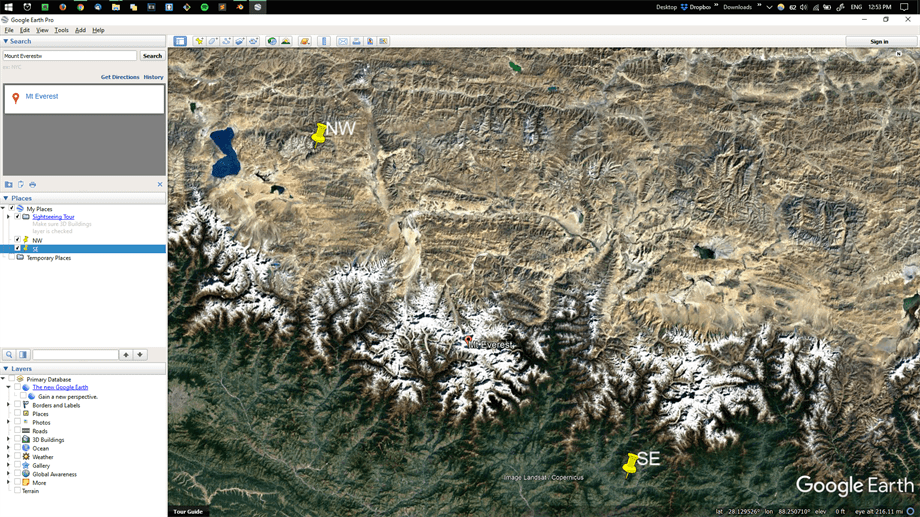
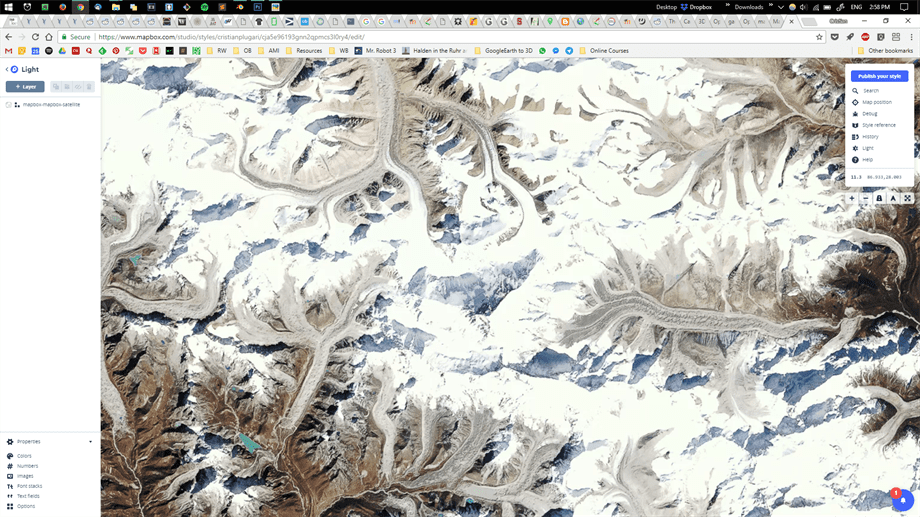
First things first - in order to print a geographical area, we need to decide which area is going to be printed as well as extract the data. Which ohter place on earth to pick, other than the location which attracts risky climbers and the highest altitude point - the Everest, Himalayan Mountains. Since the mountain is locate in the Himalayan range of mountains, we will extract a territory that comprises other mountains too. Here is a screenshot of satellite collected images of the teritorry that will be used to produce the print, taken from Google Earth.
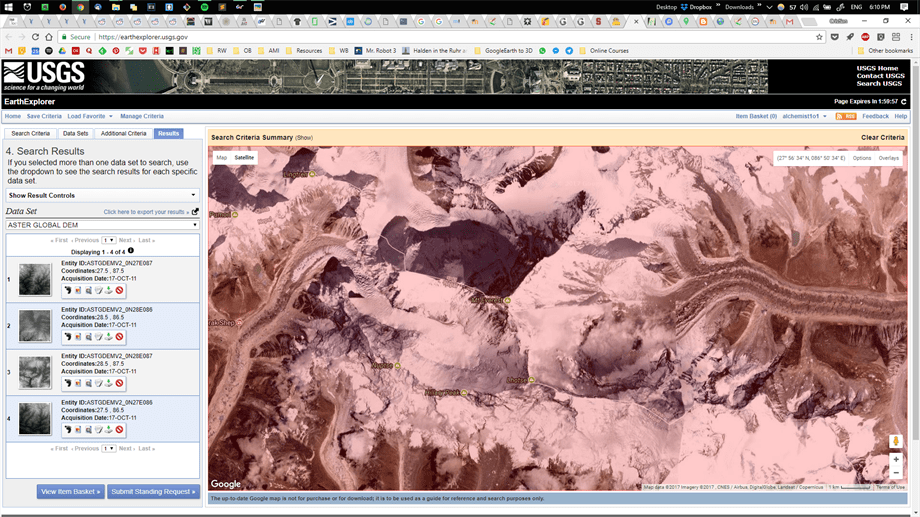
Following the instructable, we will extract the similar area data using the Earth Explorer website. We result with a four
The advantage of a .TIF extension, it is a commonly used format for
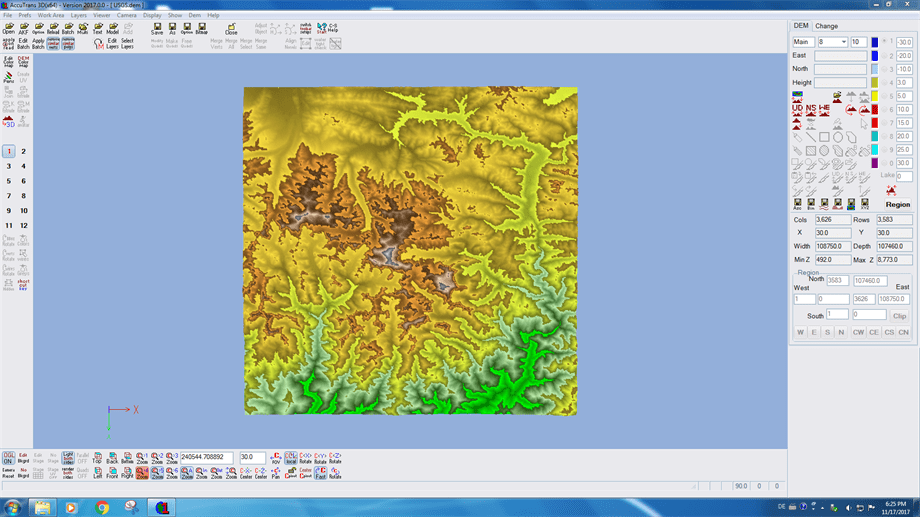
We will proceed by loading the .tif files into the
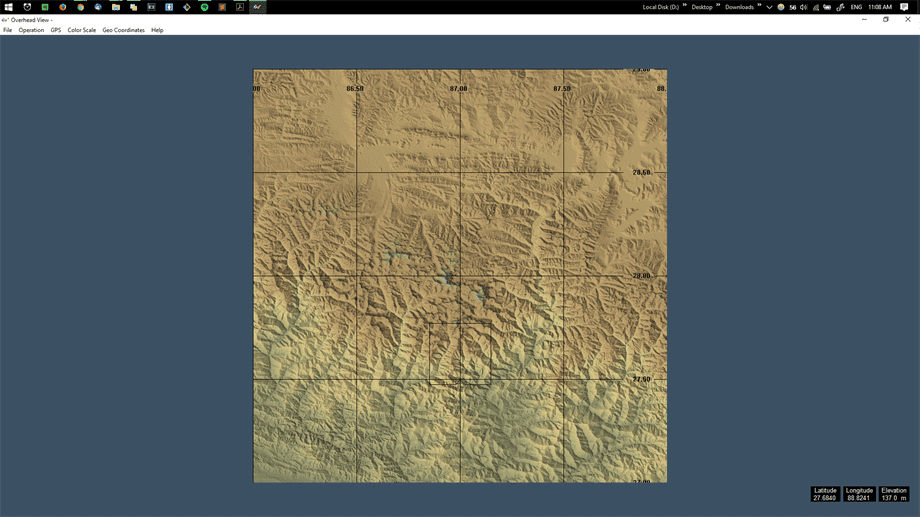
The main advantage of this geographical area is that it contains a big

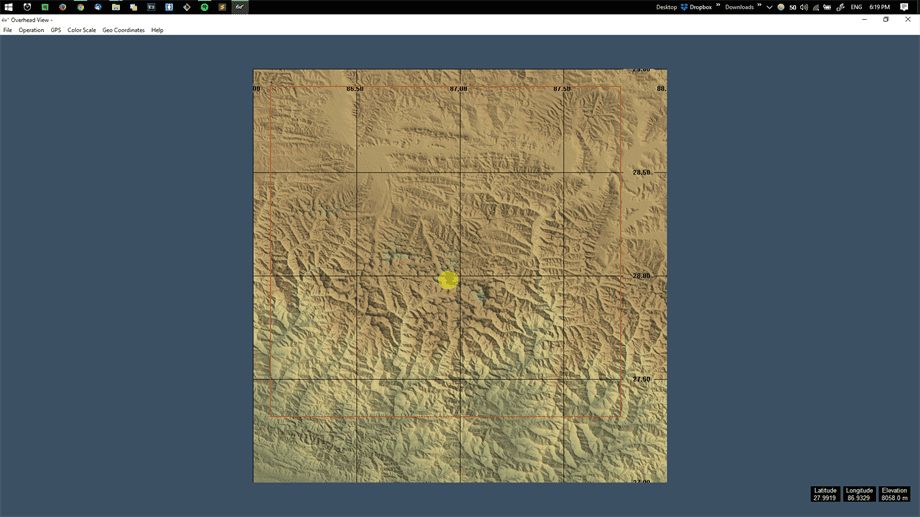
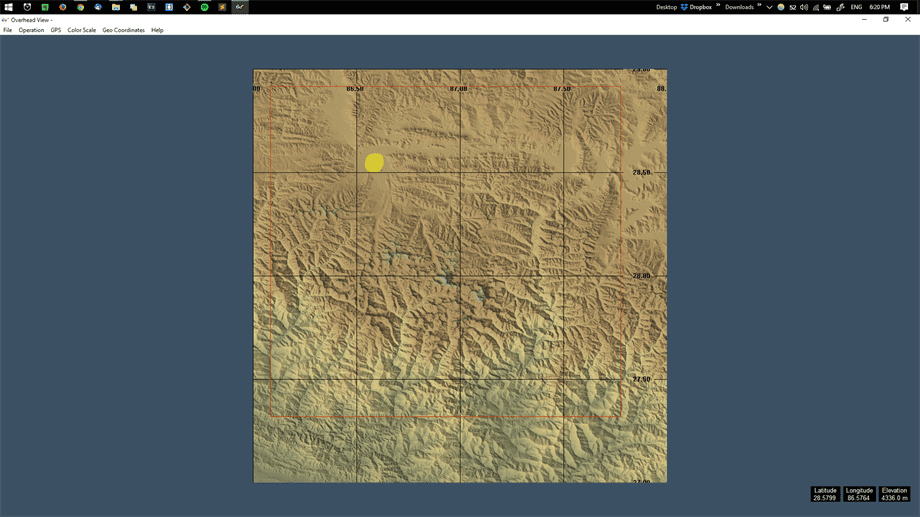
We continue by selecting the desired area that we want to print, as stated in the instructable. As a result, we obtain a square area, which is
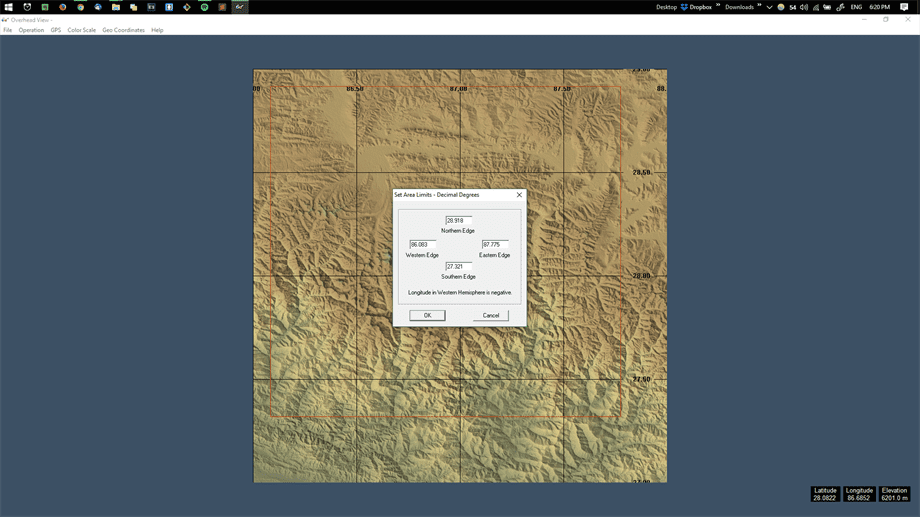
The area is then exported into the
Manipulating the 2D Layer into a 3D Mesh.
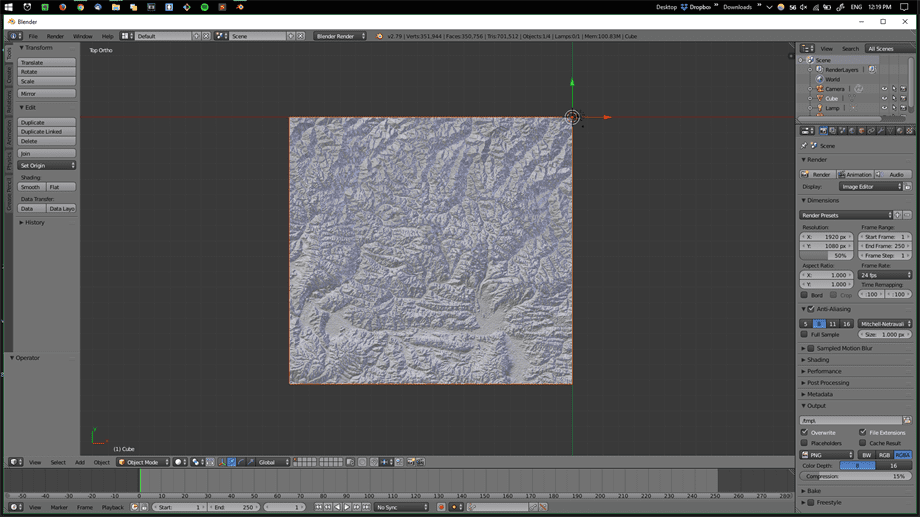
Since our structure is laying flat, which can result in a very flat objec - we would like to achieve more heightby changing the
The current
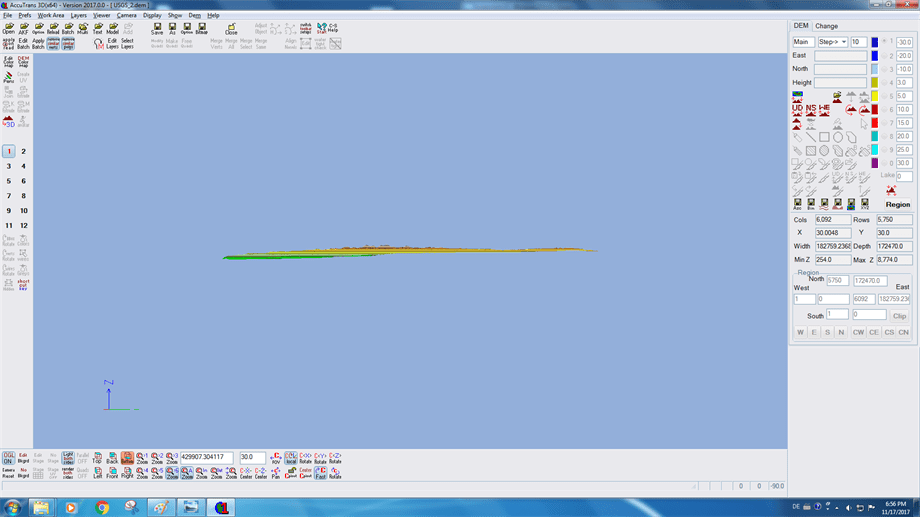
While the
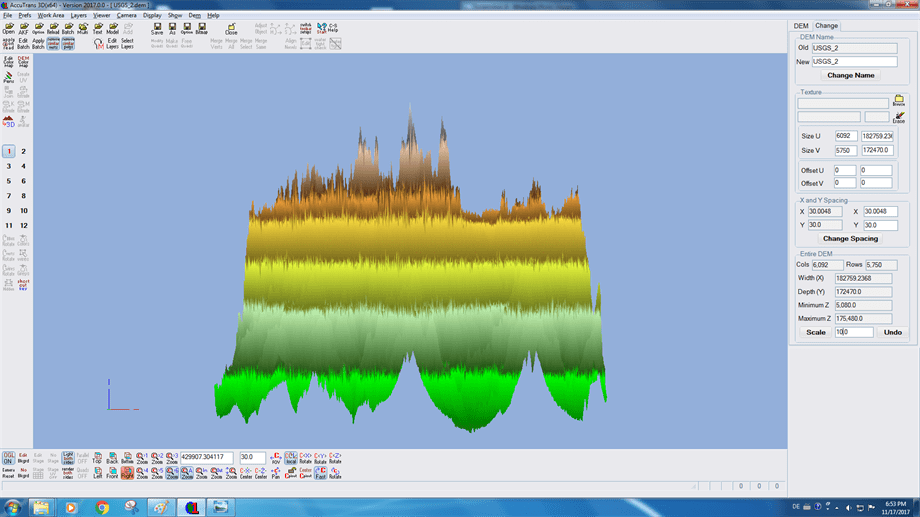
Which makes the
A 3D object is ultimately a polygon mesh, meaning it is a collection of vertices, edges and faces that defines a polyhedral object. These result in an object made of agglomeration of triangles, since laying triangles together over a surface can result in recreating the object itself. The amount of triangles acts as a role of giving the object its realistic (high poly) look or giving it a less realistic (low poly) look. The higher the amount of triangles, the more realistic the object results.
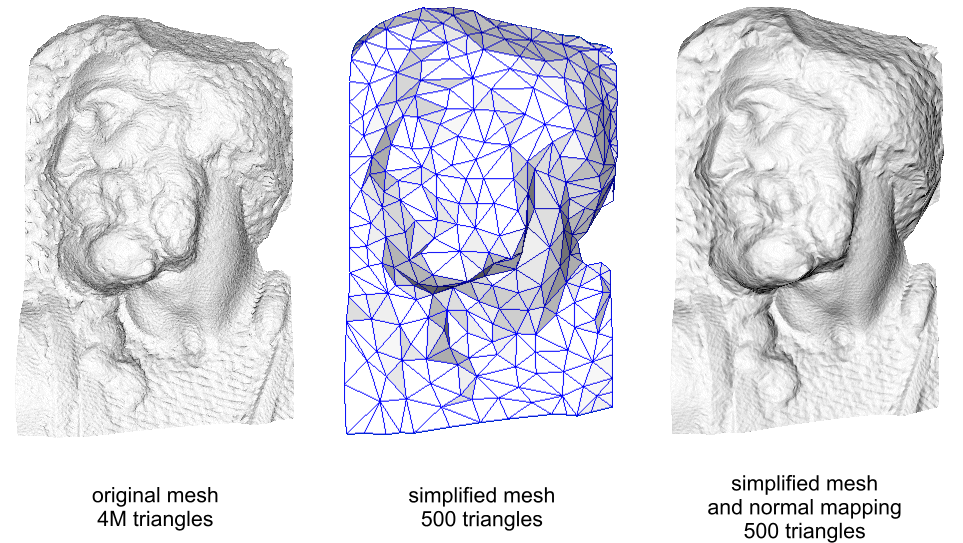
As in terms of our geographical, different poly levels can be seen as well.
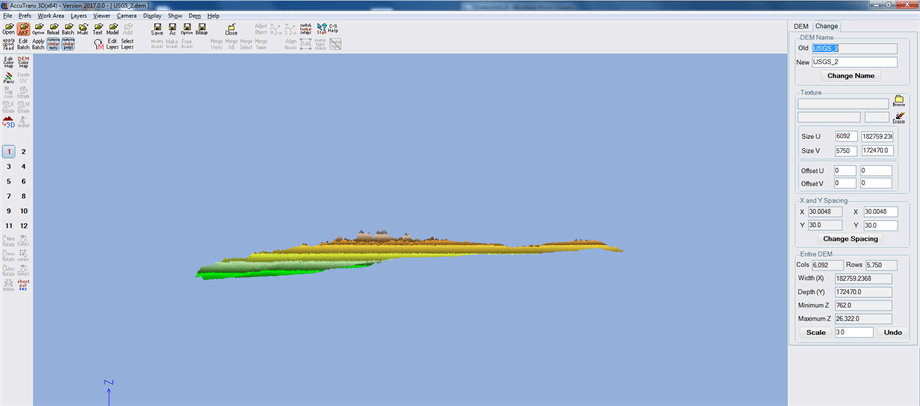
In this case the object has a very detailed structure, which equals to a higher amounts of triangles due to it's abundance of small curves and creases that comes from natural geographical shape. This can result in slow processing of the object by the 3D software, which ultimately results in more processing power needed in order to speed up the process. The author of the instructable recommens sticking to an amount less than
10.000 triangles can result in a slow editing process. So we will stick to the 10.000 parameter when we will export the object in

Giving 3D object Color
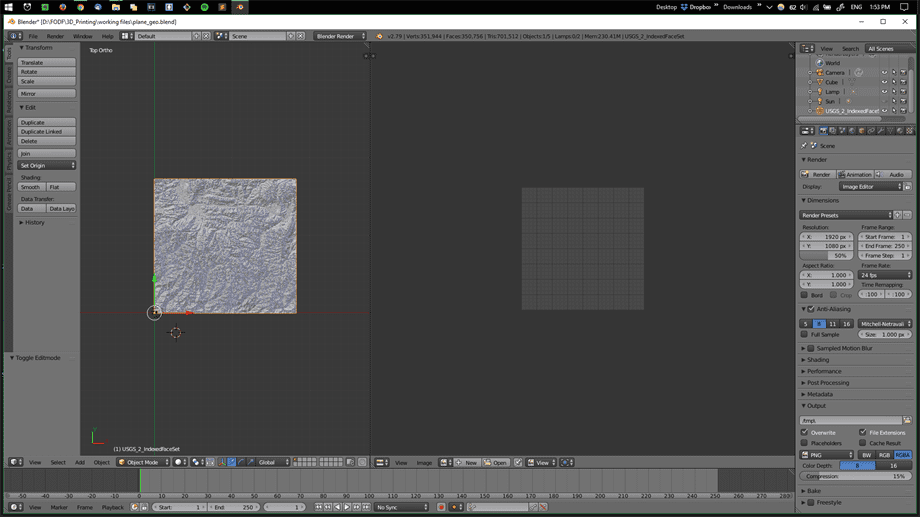
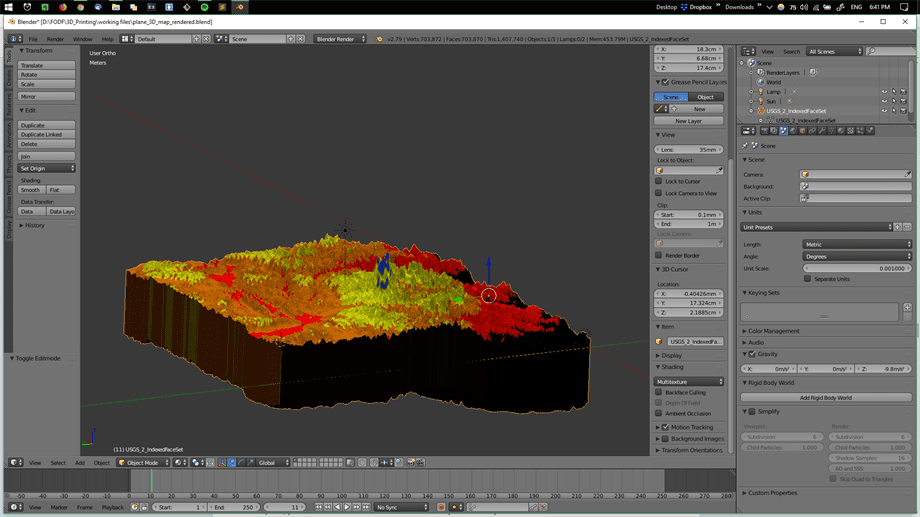
Once obtained the .x3D file, we proceed by importing it into the Blender Software, which is a handy software for manipulating complex 3D objects. We will use this software in order to
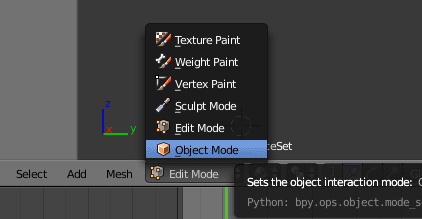
Once the object is imported, we need to change the view by going to
We rotate the object in order to make it coincide with our initial screenshot of the geographical space. To accomplish that we go to the bottom panel and select instead of 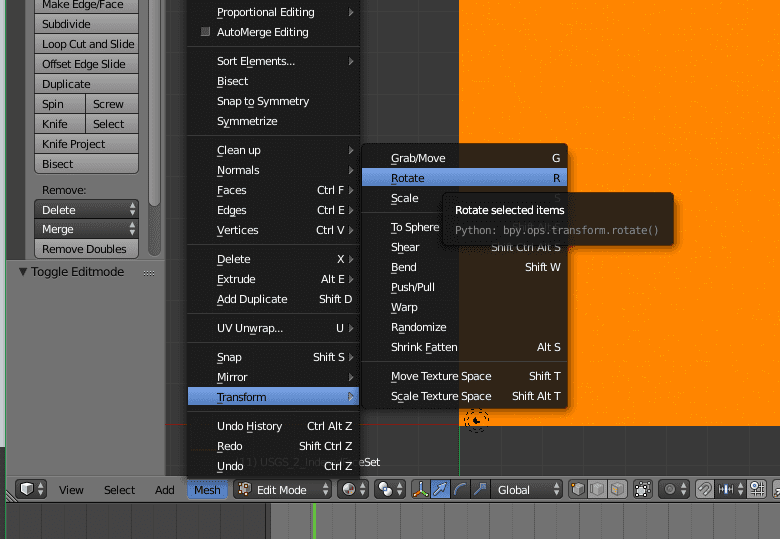
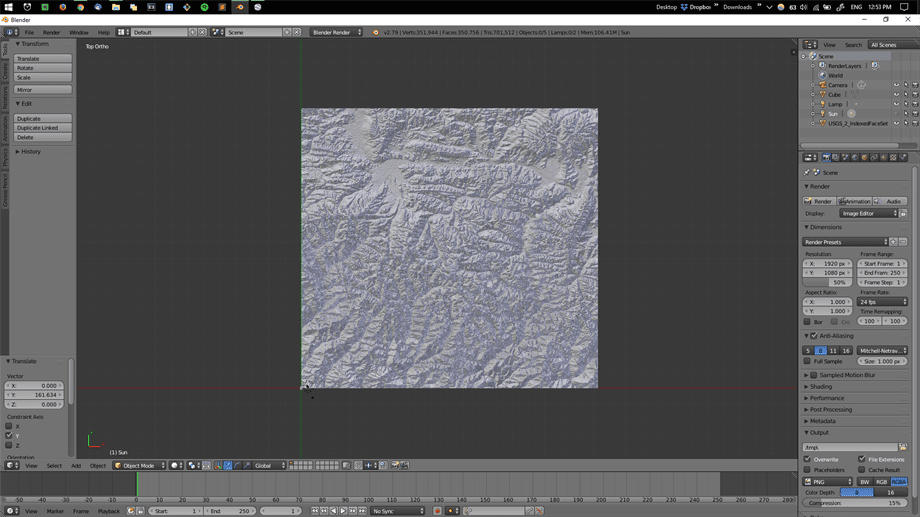
As explained in the tutorial, we would like to
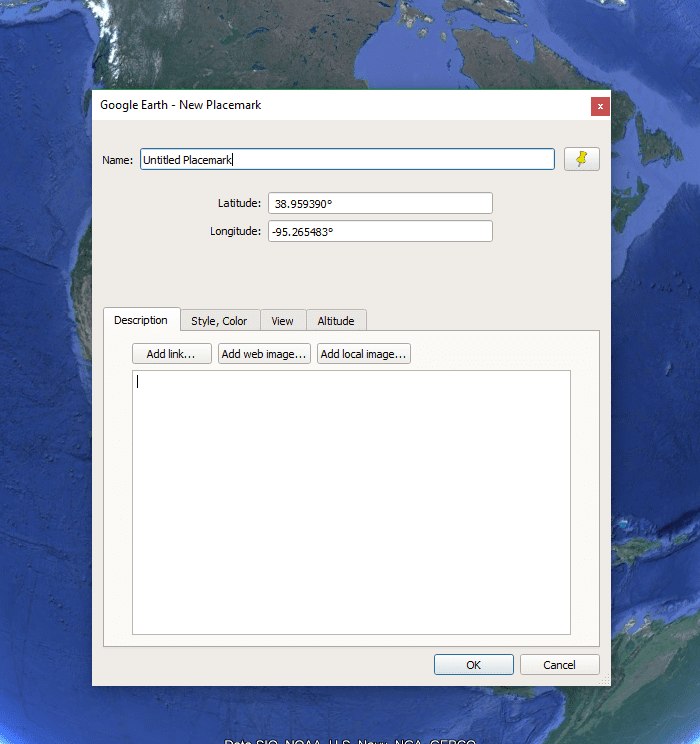
We result in having two pins that create the borders of our area.
By going to
By following the instructable, we add a
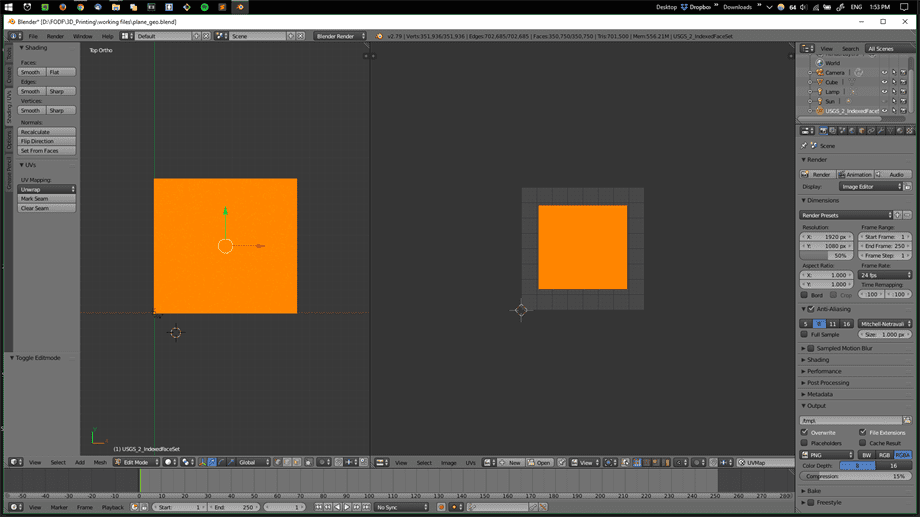
Here is the result of importing the image border, layering the previously extracted satellite picture from Google Earth and stretching the picture according to borders using
Adobe Photoshop
.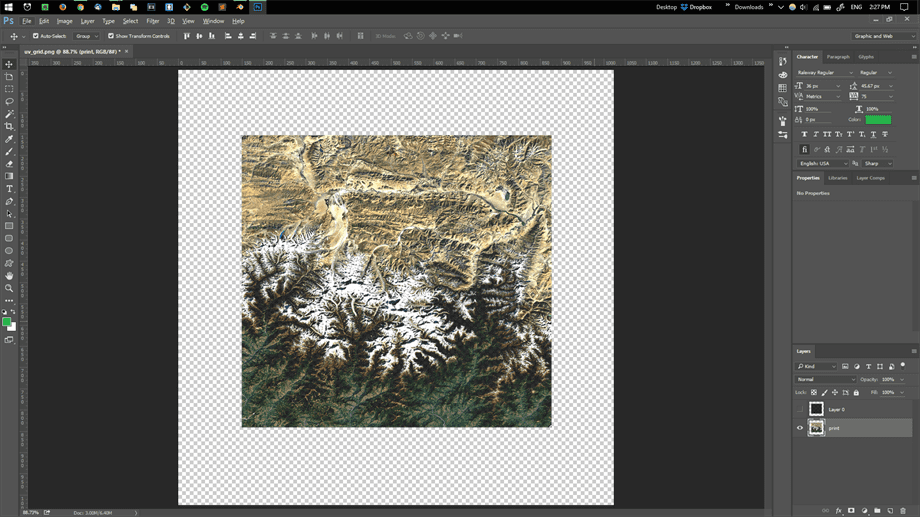
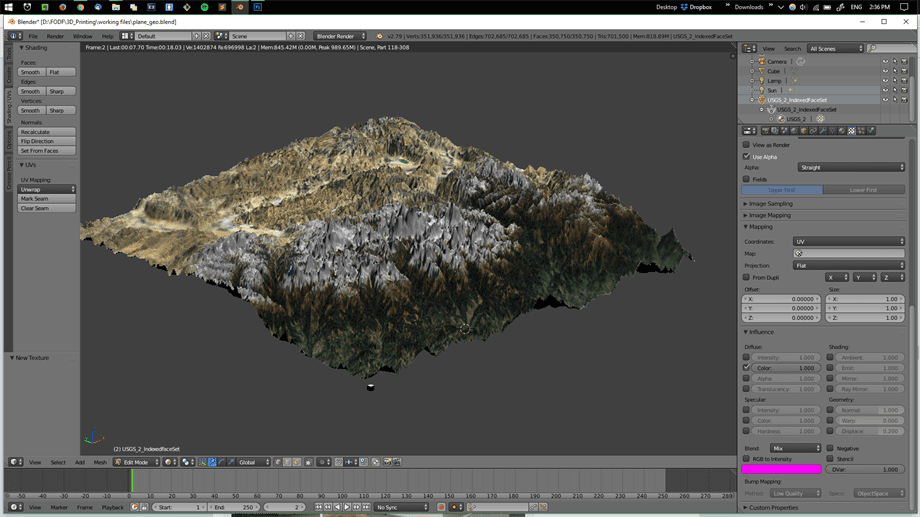
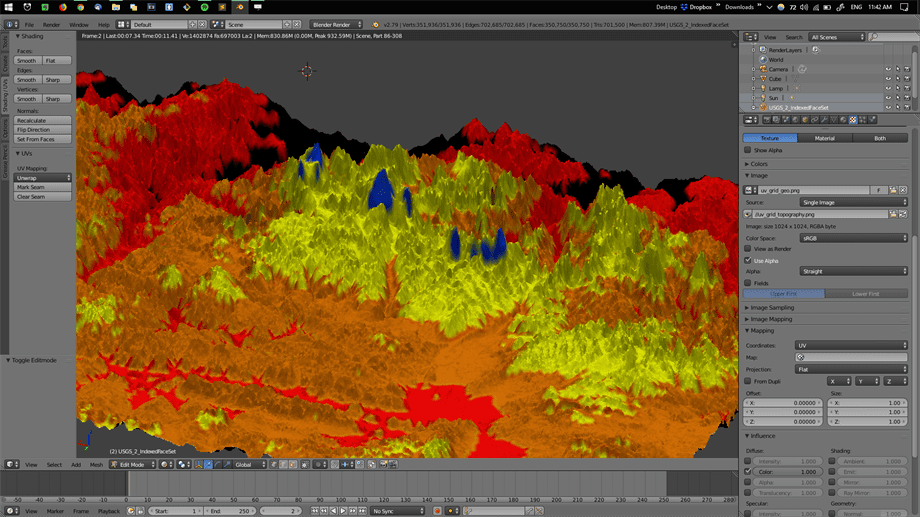
Once our image is exported and overlayed and the 3D object is rendered, we can see the recreation of our geographical object in 3D with color.
Embedding Geographical Information using Z Axis and Image Overlay
Everything done until now was mainly guided using the previously mentioned instructable. The overlaying of the satellite picture was done in order to test whether the coordinates were right and everything was done right up until this point. Now we branch out from the previous project by focusing on the elevation of our geographical object.
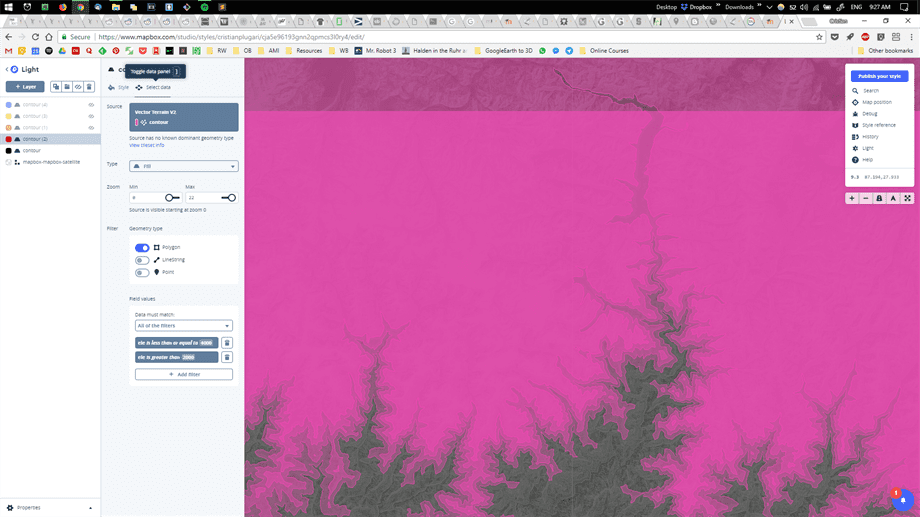
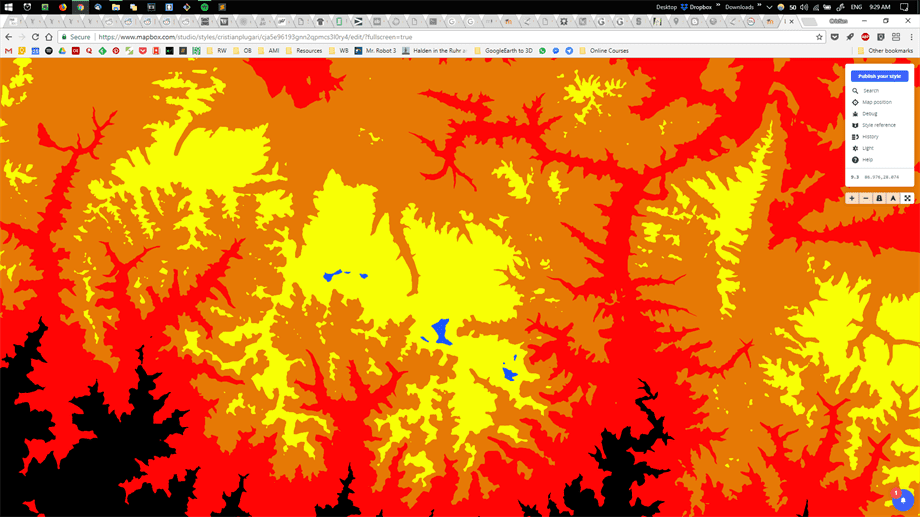
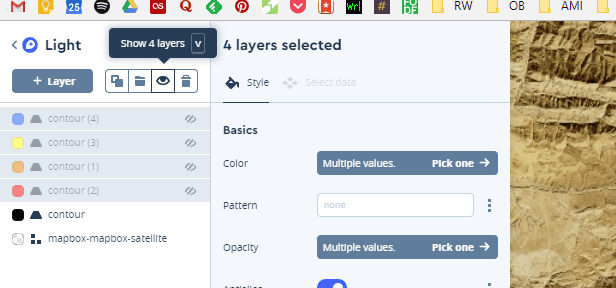
To get an image map that will contain the information we specifically want, that will be later overlaid on top of our 3D mesh, we will need to use a tool that will allow us to modify the look according to the elevation level. For that we will be using Mapbox Studio. This tool allows us to separate different elevation levels by creating layers and giving them a different color for visual delimitation.
We will proceed by creating a
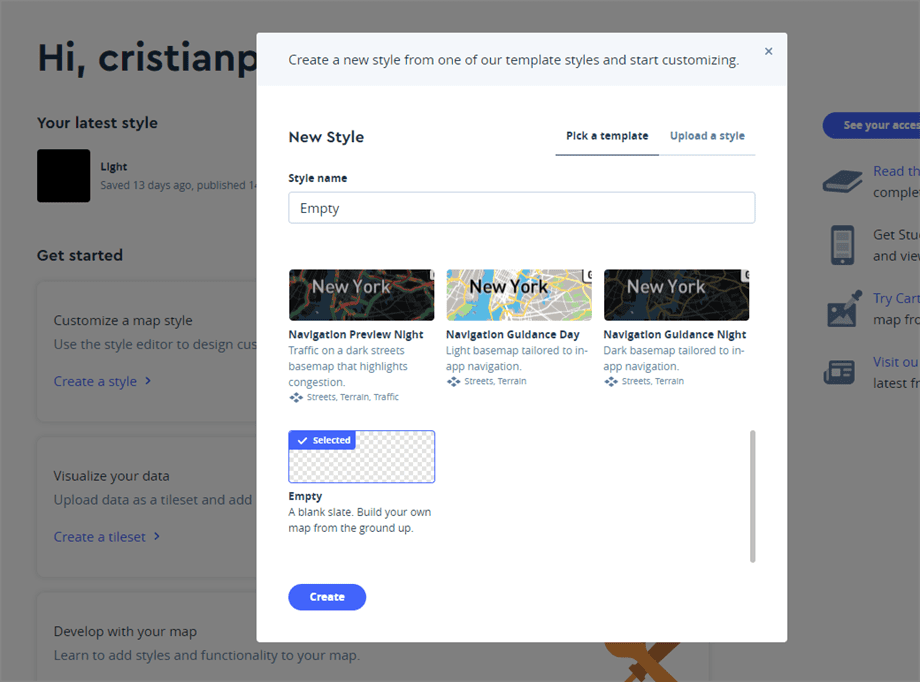
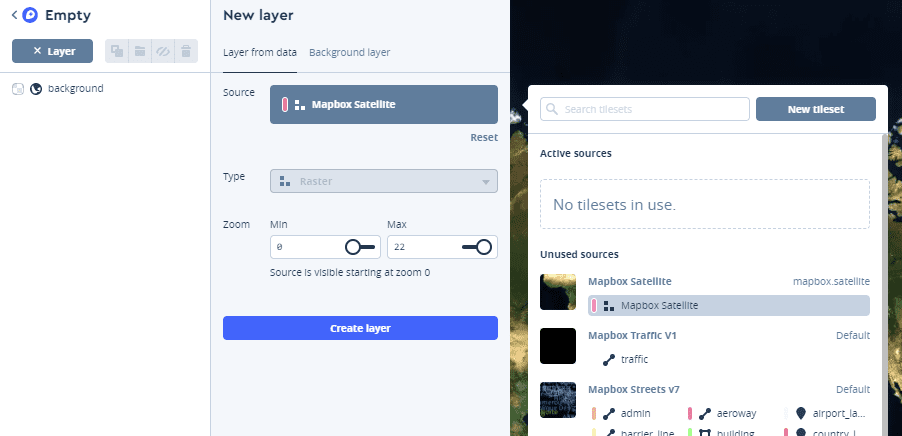
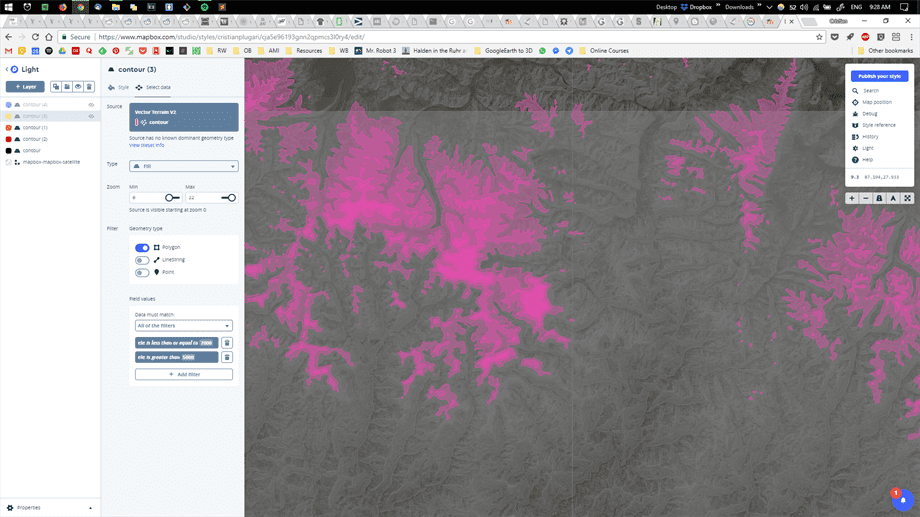
We proceed by creating our first
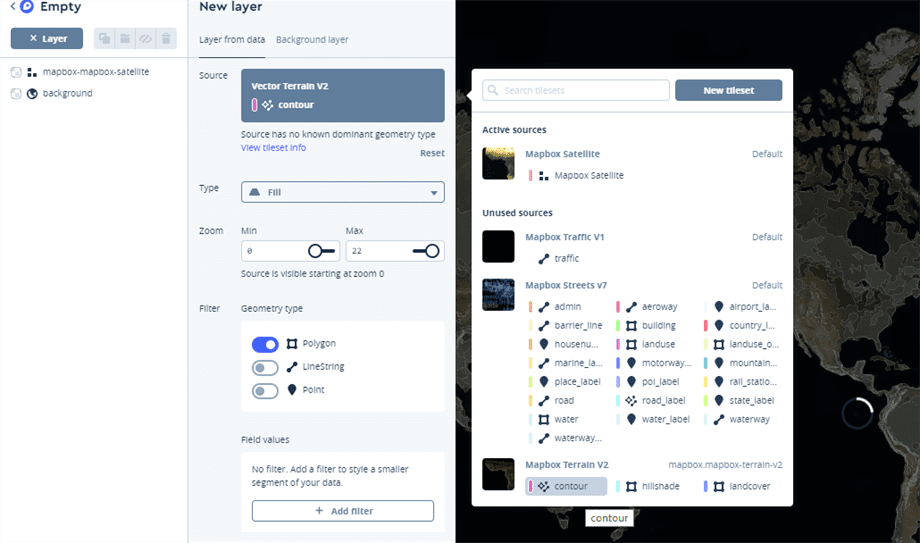
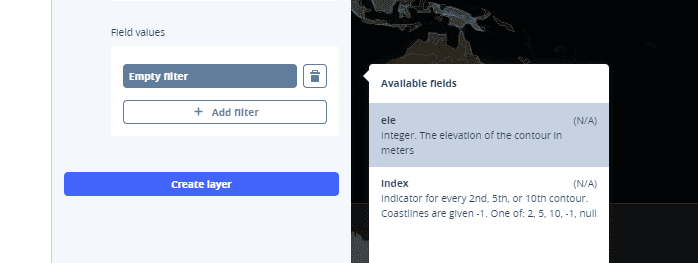
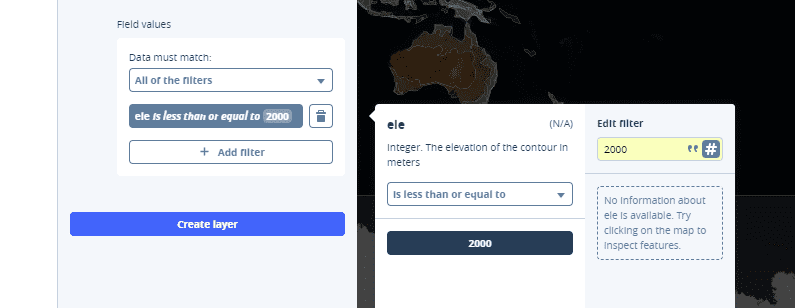
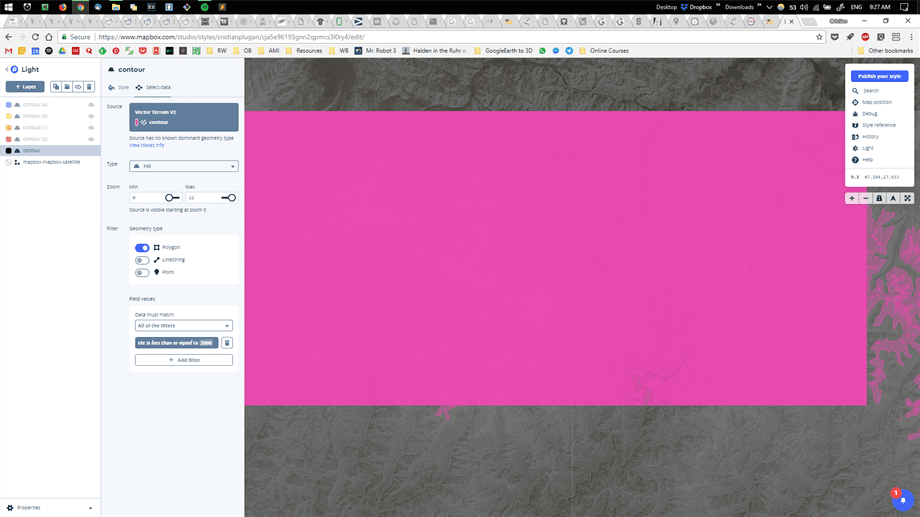
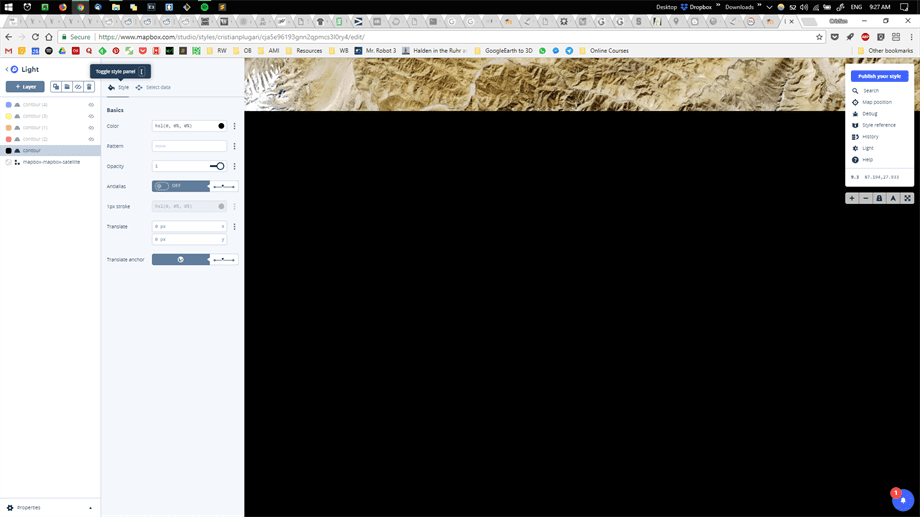
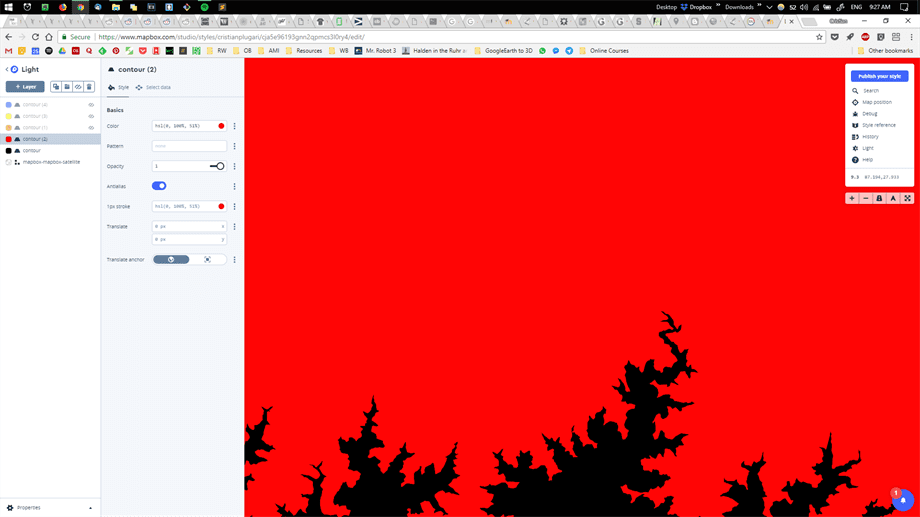
Everything highlighted in purple represents the area that matches with our previously indicated criteria. We will give it a black color for this instance.
We will proceed in a similar fashion for our next four layers.
2000 to 4000 meters.
4000 to 5000 meters.
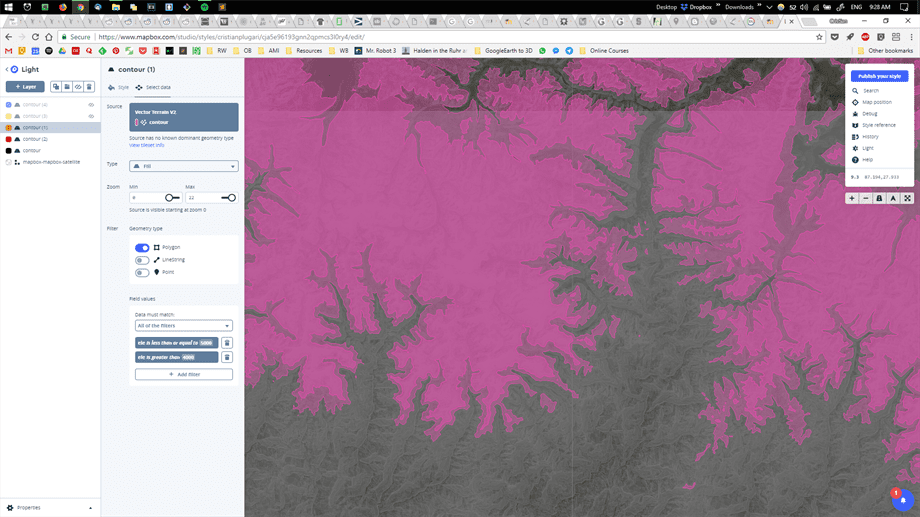
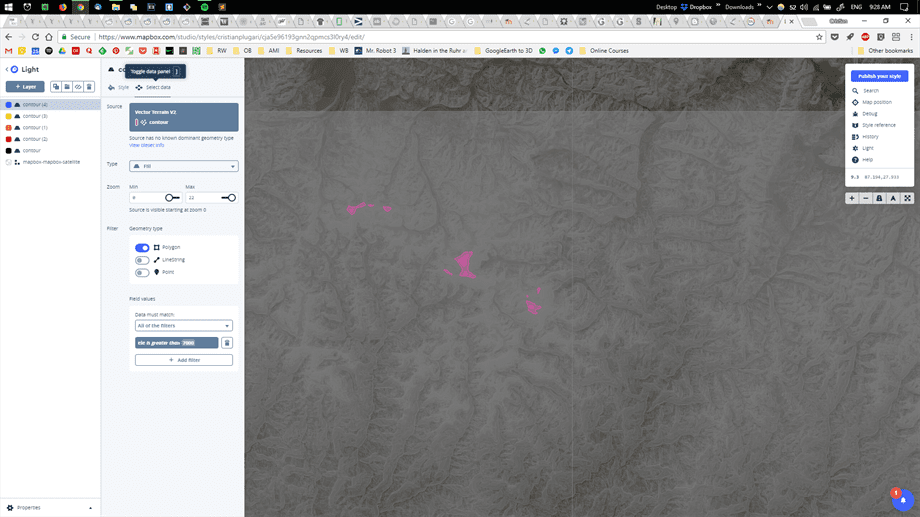
5000 to 7000 meters.
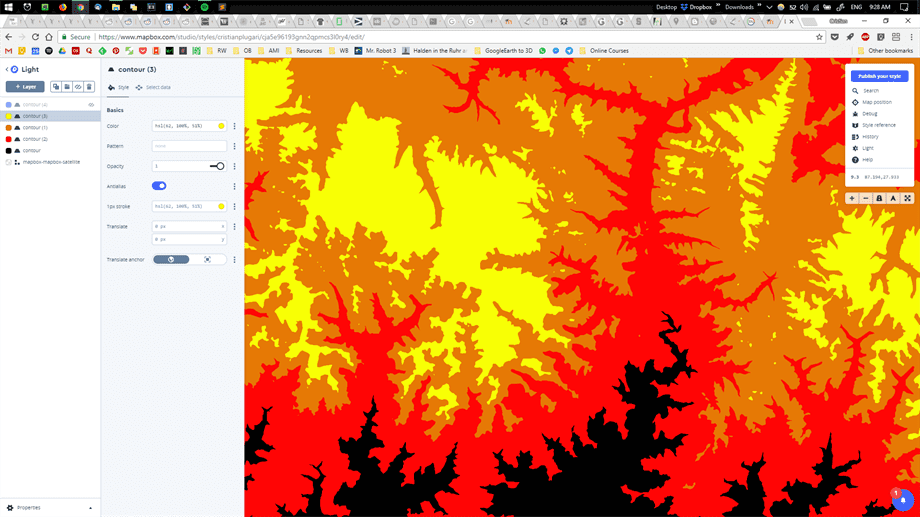
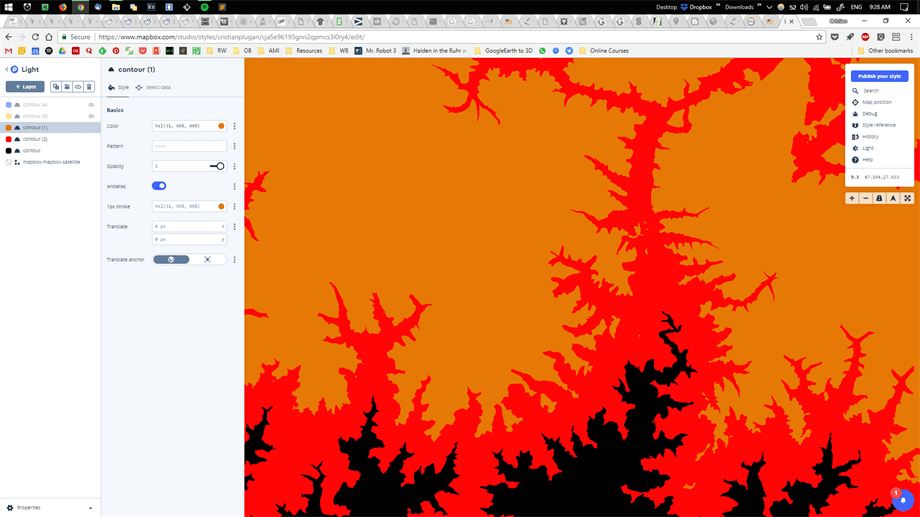
7000 meters and above.
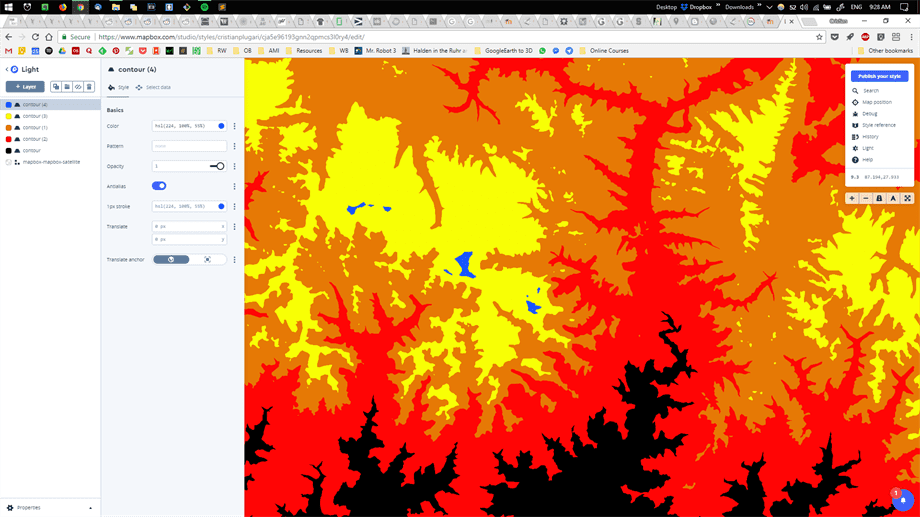
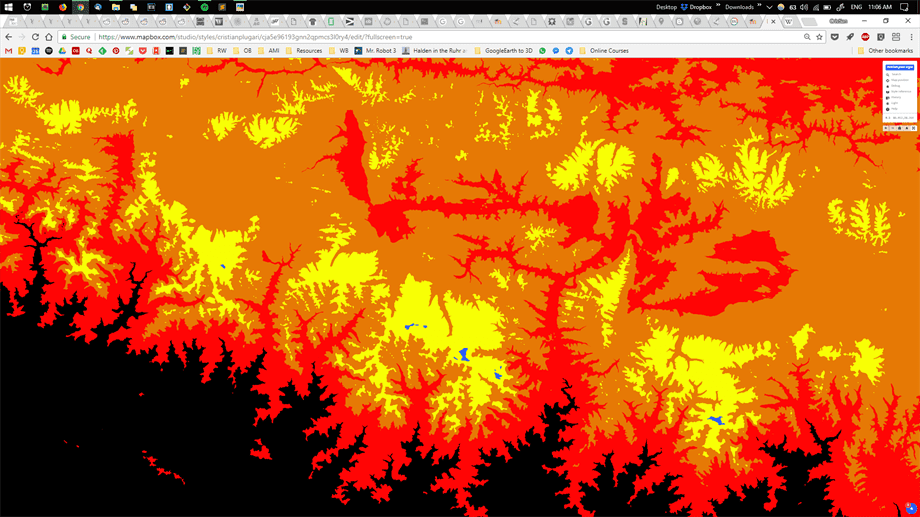
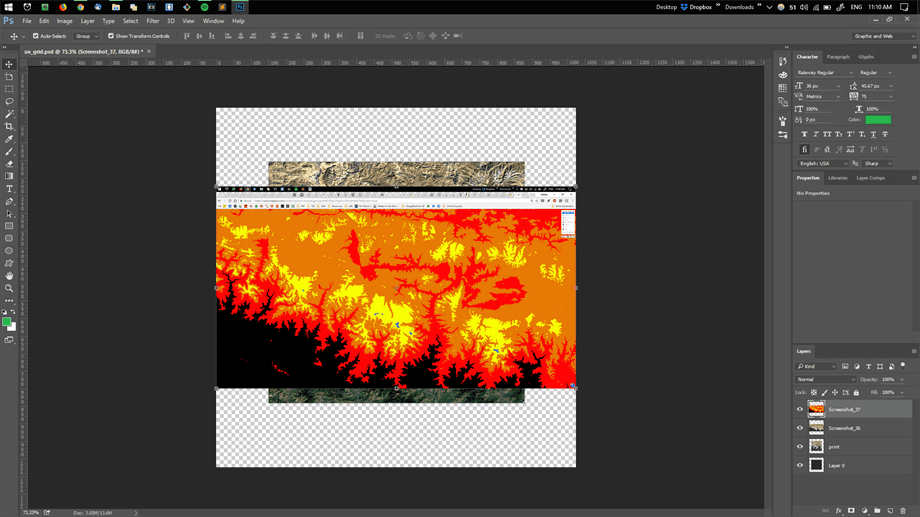
We finally result in such a coloristic map, with such specifications:
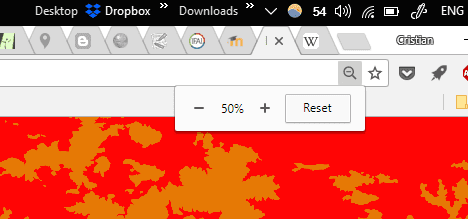
In order to do a screenshot for this map, it is simply not enough to zoom out if the area is as big as the one particularly chosen. Since Mapbox software limits the view of Contour layer if the
We will proceed by taking a screenshot of the entire area of both,
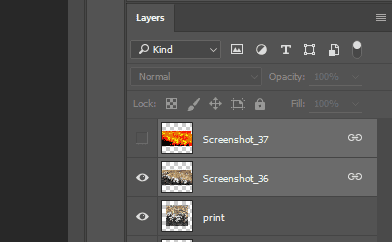
We import both screenshots into the Adobe Photoshop file. Once imported we link both layers so that any sizing changes done on one layer will directly impact the other.
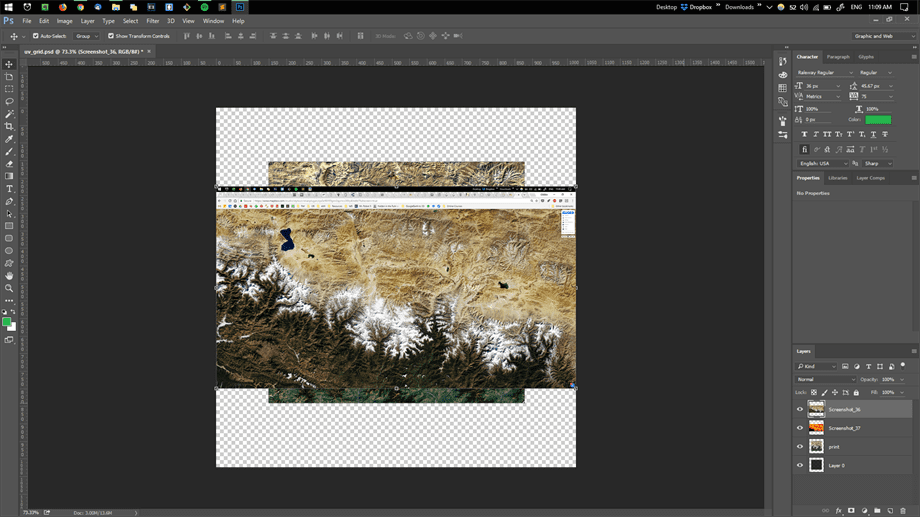

We proceed by first disabling the visability of our
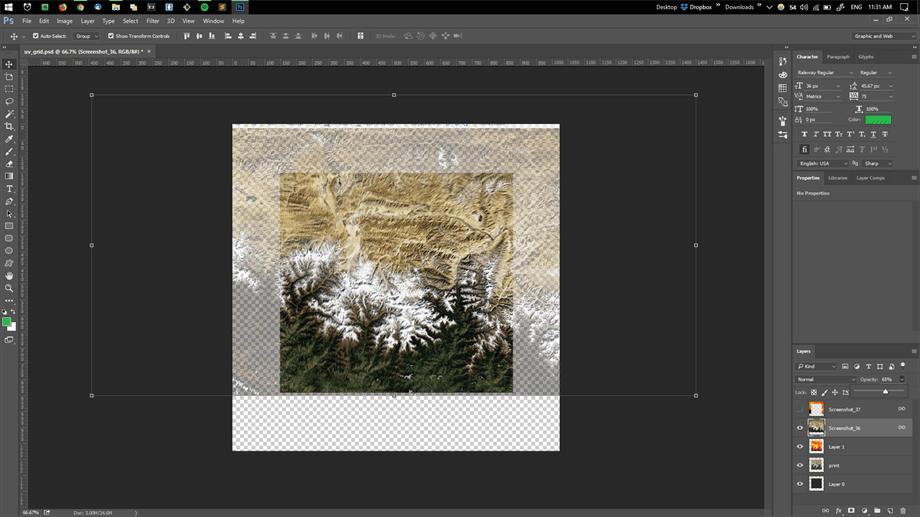
Ultimately we would like to overlay both layers over our first original screenshot so that the Mapbox layer will arrange accordingly to the elevation of the 3D model.
Once this is accomplished, we will proceed by exporting only the Mapbox layer in a .png file, this is ultimately overlayed over the 3D mesh and results in a coloristic 3D rendering.

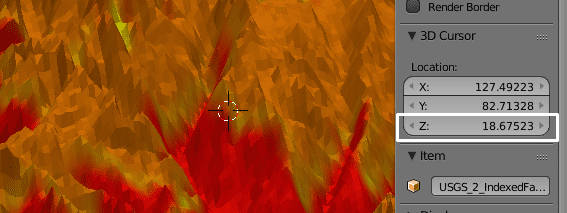
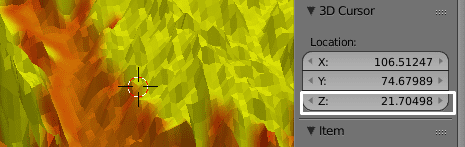
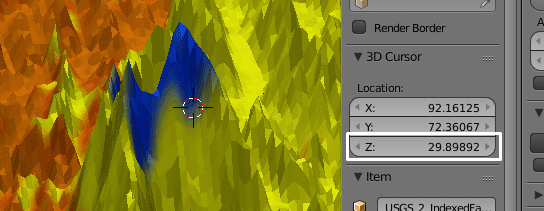
Using the existent model, we can navigate closer to where the color is changing for each layer and determine at which height our physical print will need to change the color, by using our
First we need to change from
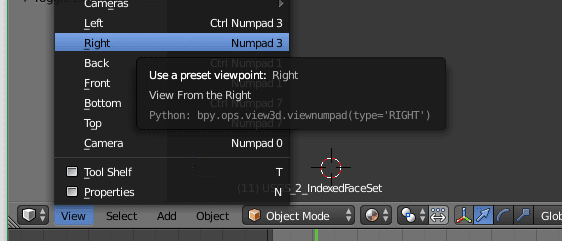
Then set the view to
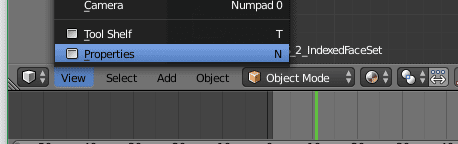
Then click on the bottom-left corner with the mouse, go to
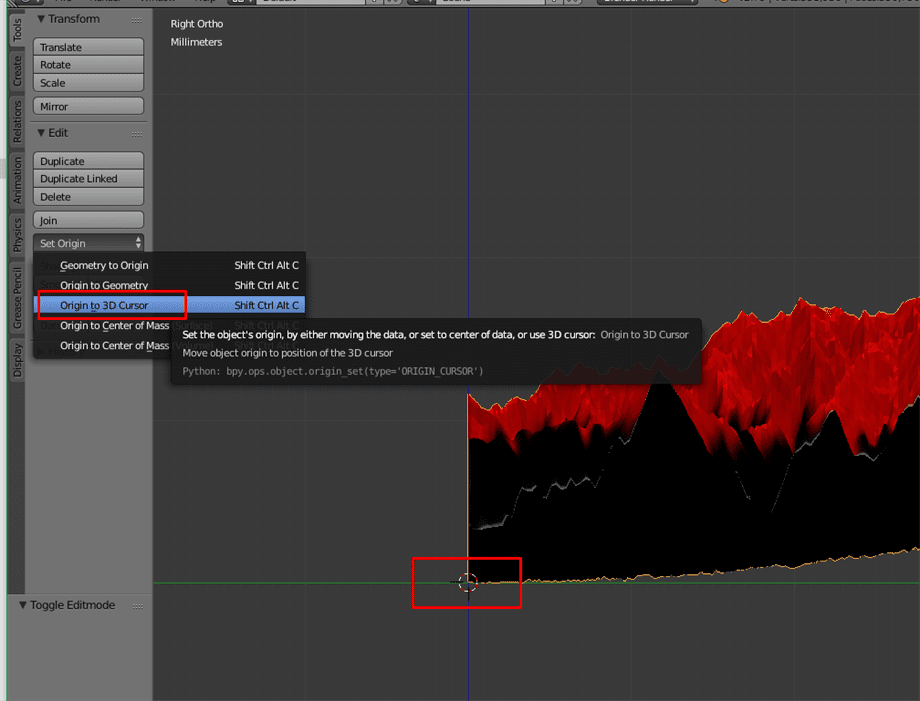
Then find the
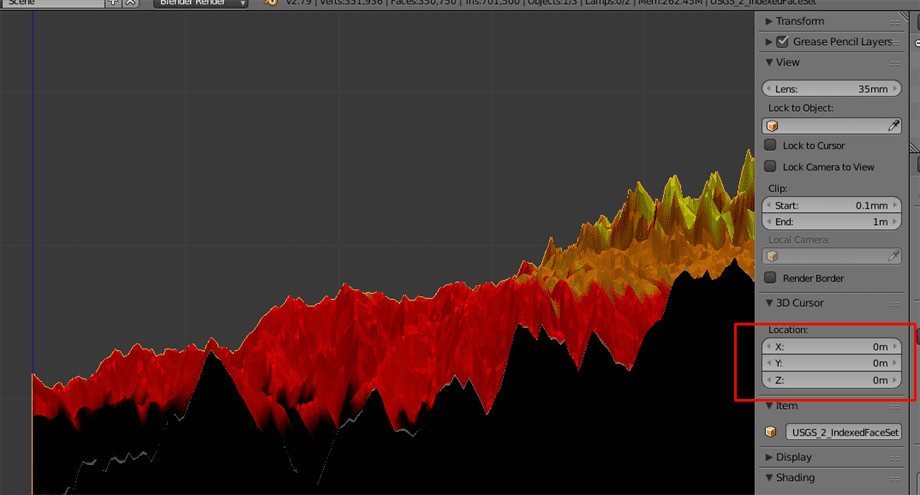
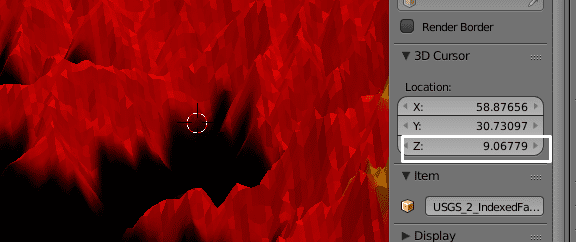
Now we will collect the height information for the object, where it changes it's color.
Important is right now to extrude our object. This operation is well explained in the instructable and looks like this.
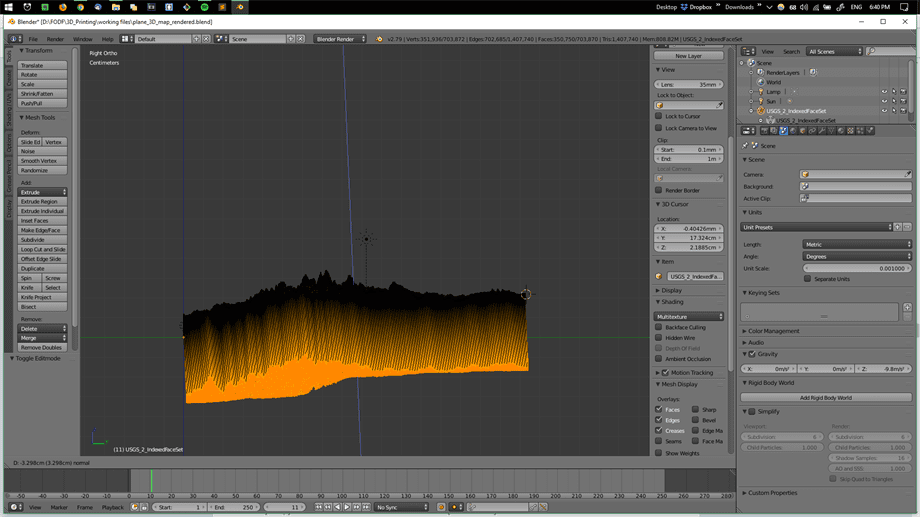
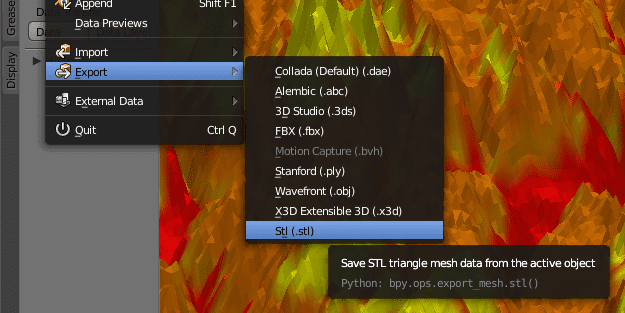
We will go ahead and export this object as an
Creating layer heights for multiple color print
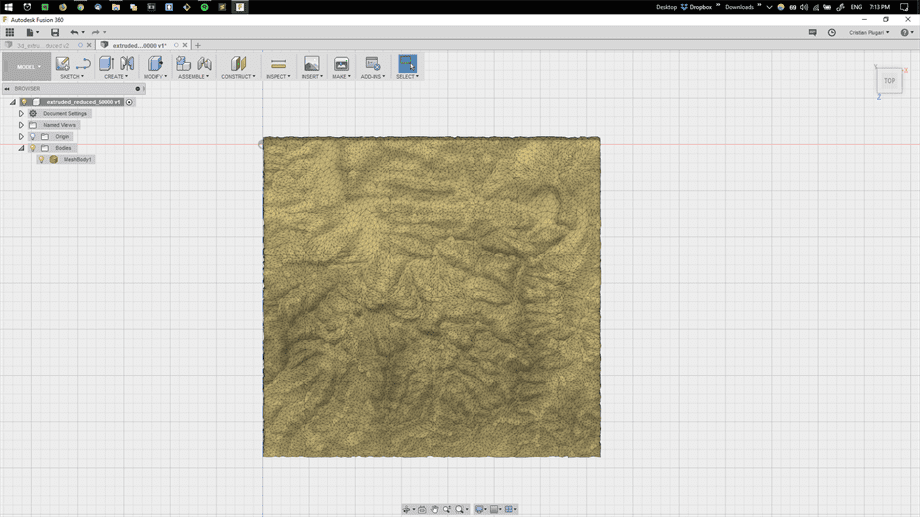
We will proceed by importing our object into Fusion. To accomplish that we need to firstly upload the object into Fusion and then import it again. The result is a mesh object which looks like this.
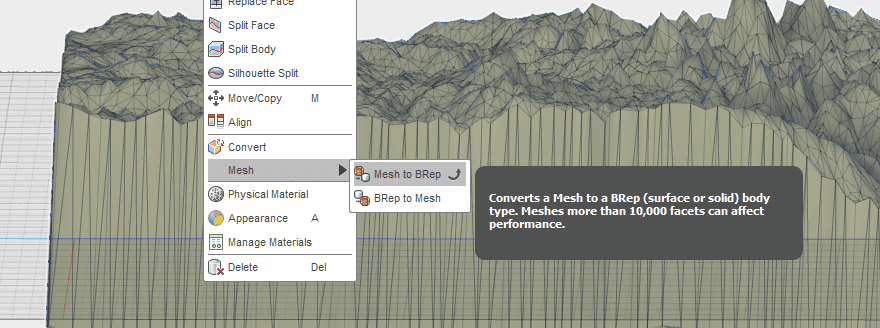
We will go ahead and convert this object from Mesh body to Brep in order to be able to finally export it for printing. To accomplish that we go to
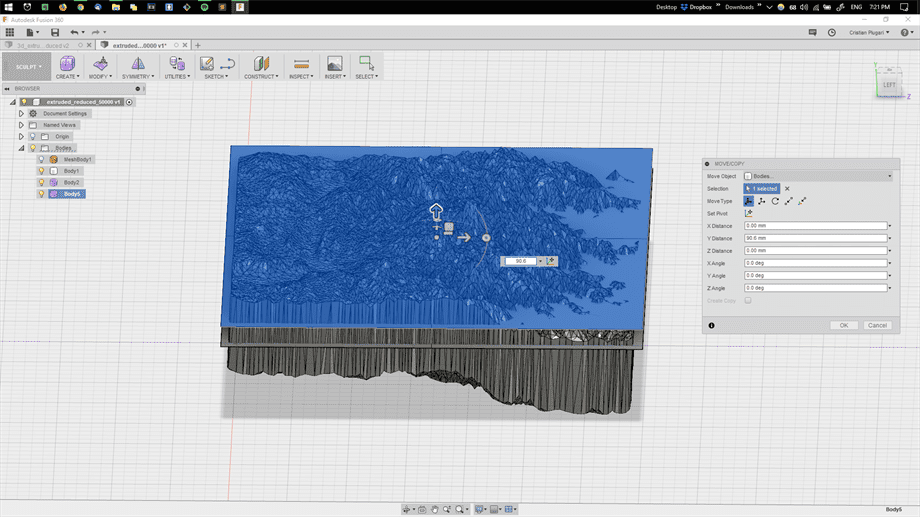
It is important to lift up the object so that the part where the Top of the geographical area starts to shape is 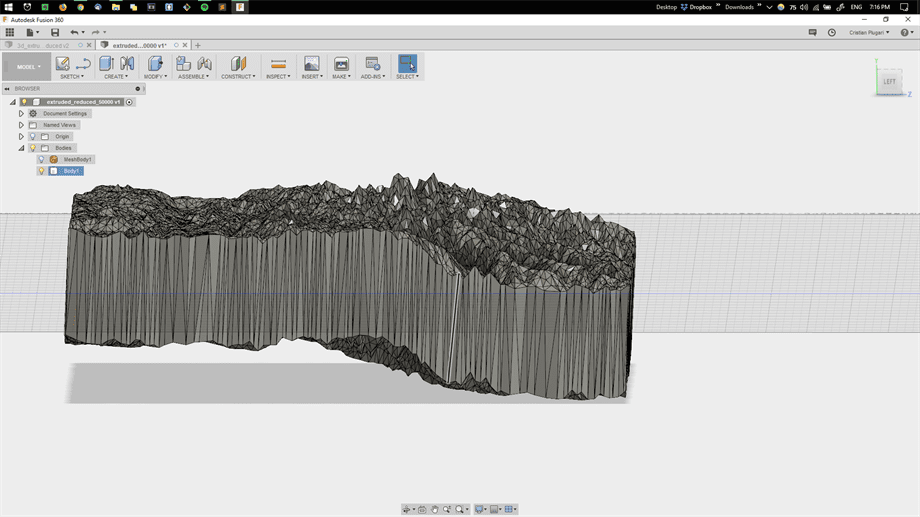
We continue by creating a series of planes that are parallel to the O Z axis. First plane will disect the object to create a flat bottom side and the rest will result as copies of the first plane, with Z height that we have previously taken using the Blender software.
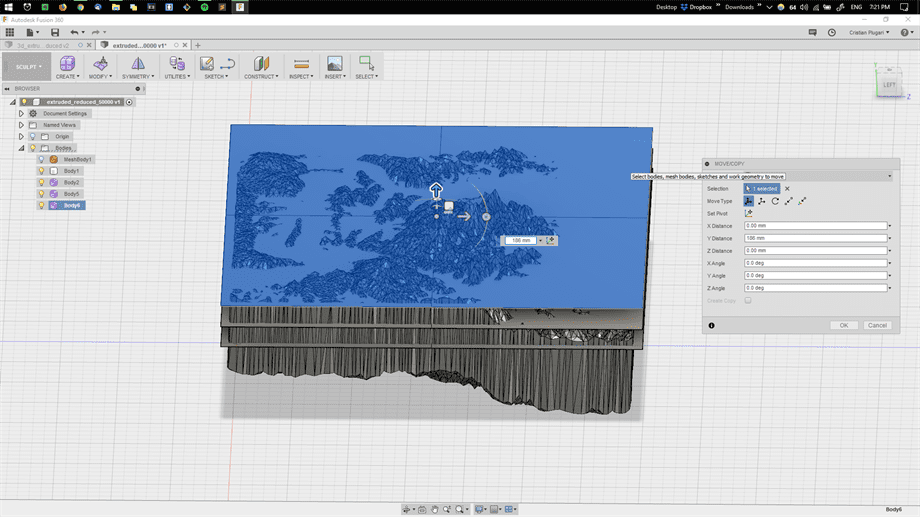
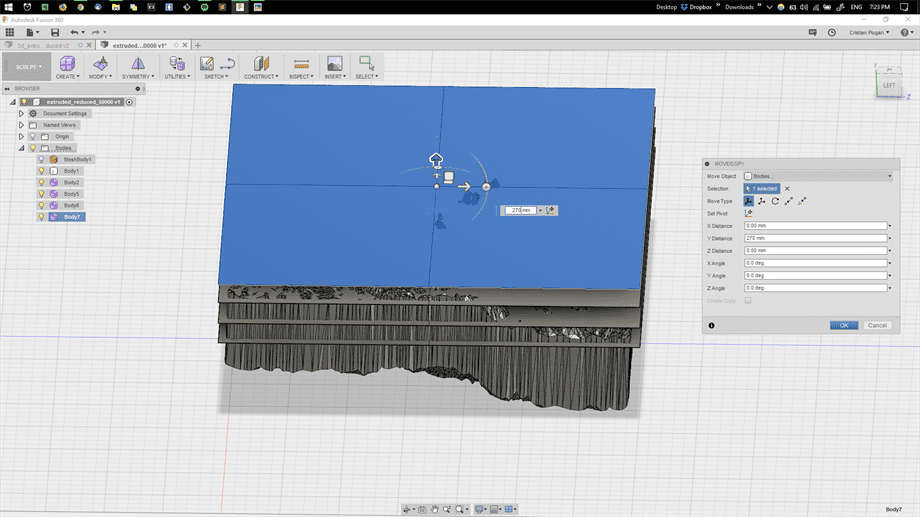
This results in a stack of layers.
We need to get rid of the bottom side of the object and make it flat. For that we will use the
For the
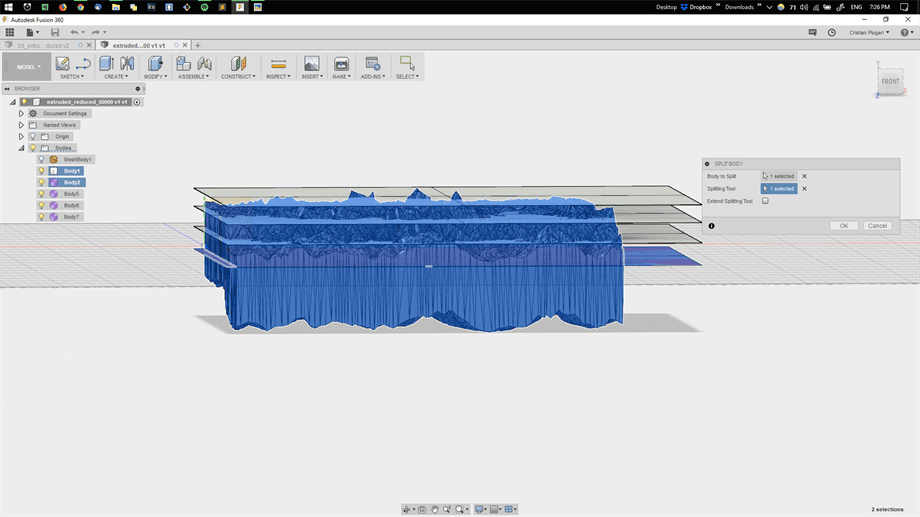
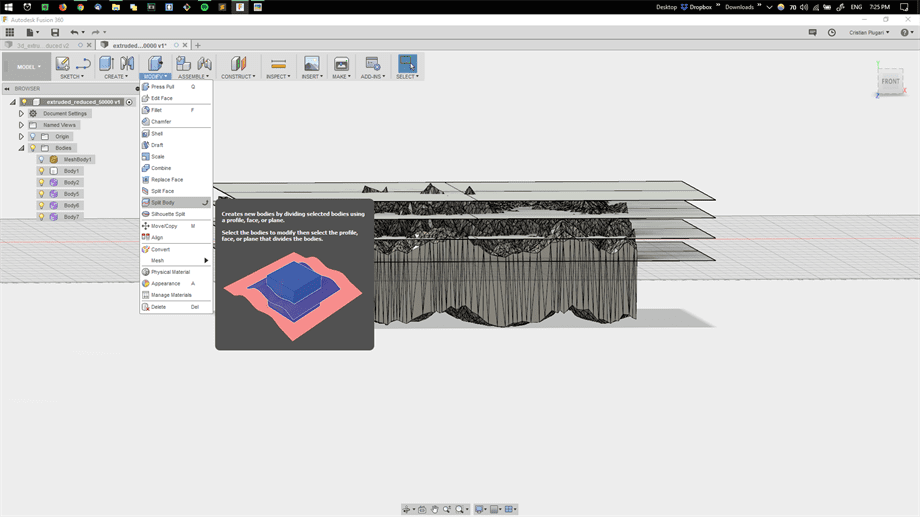
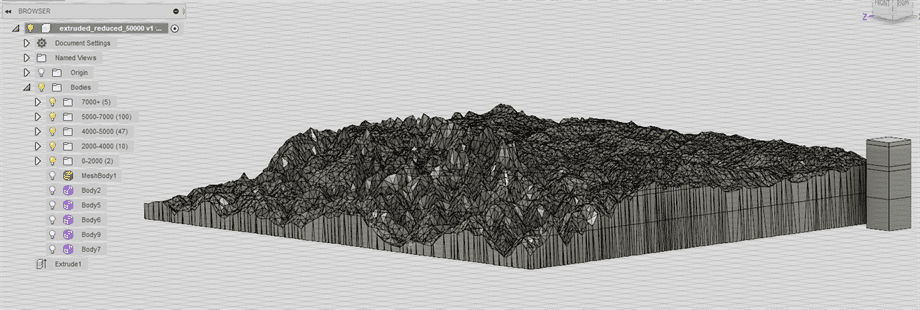
Now important is to create a tower that will be sitting nearby our 3D object and will be ultimately sliced using our planes. Slicing the original object takes a lot of computational power and time, so we will avoid that. The tower should be of square face and extruded along the height of our object. Then we will slice it using the previosuly mentioned slicing function.
We continue by splitting our tower by using the previously created planes and the splitting tool.
Because the object was too big, I have scaled it to fit my print together with my tower for the reference. This is an optional step.
Now we go ahead and measure the height of each layer of the tower. This height will give us an idea where to
Using the
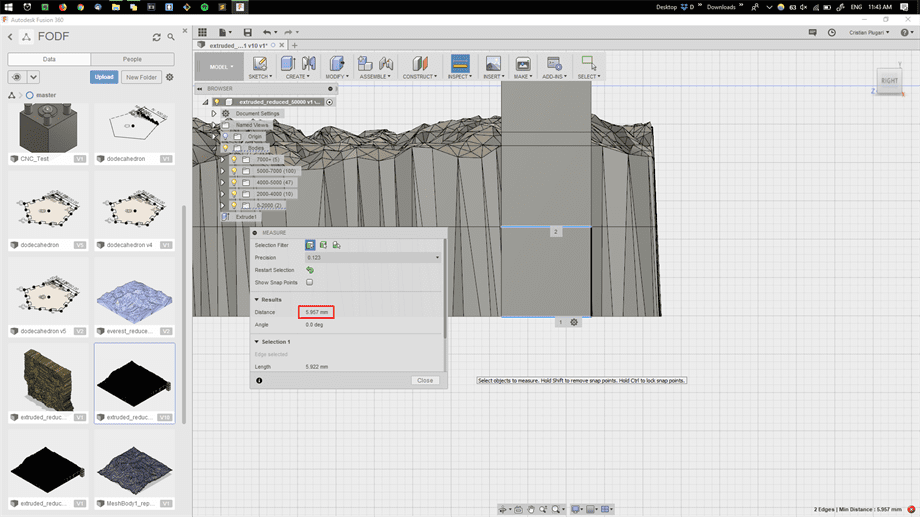
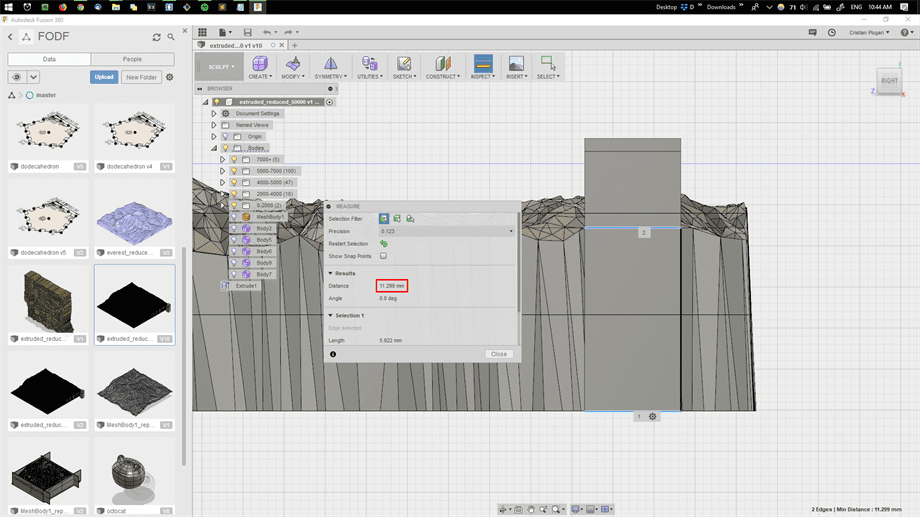
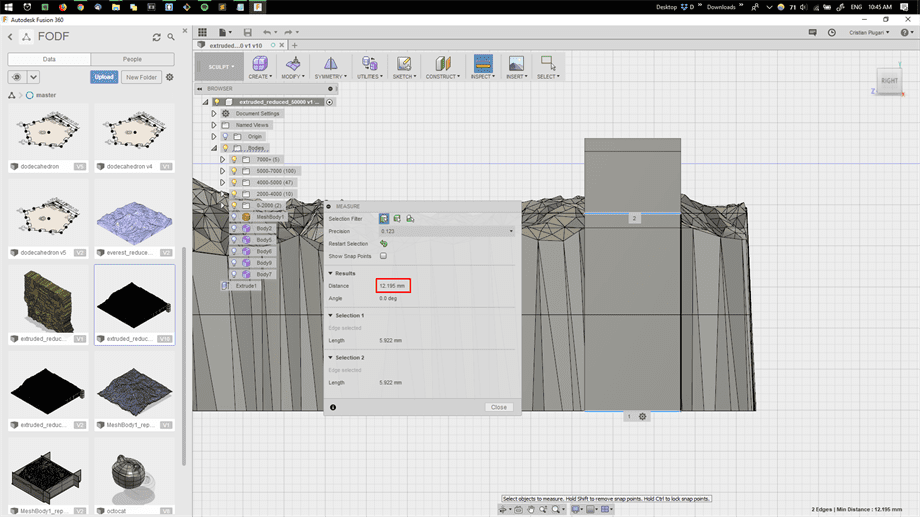
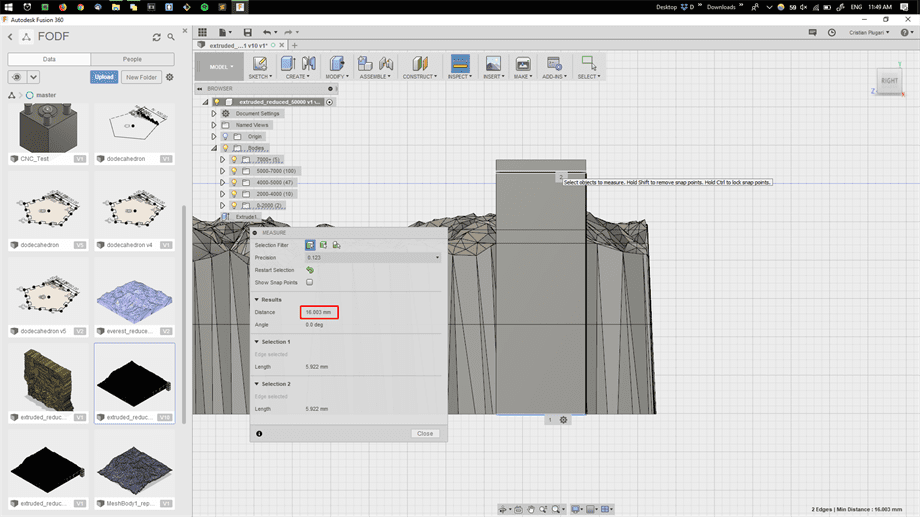
As a result we have the following information for the splitted body:
At this moment we can proceed by getting deleting our tower and exporting the object. We will export the object as a
Printing with Different Colors
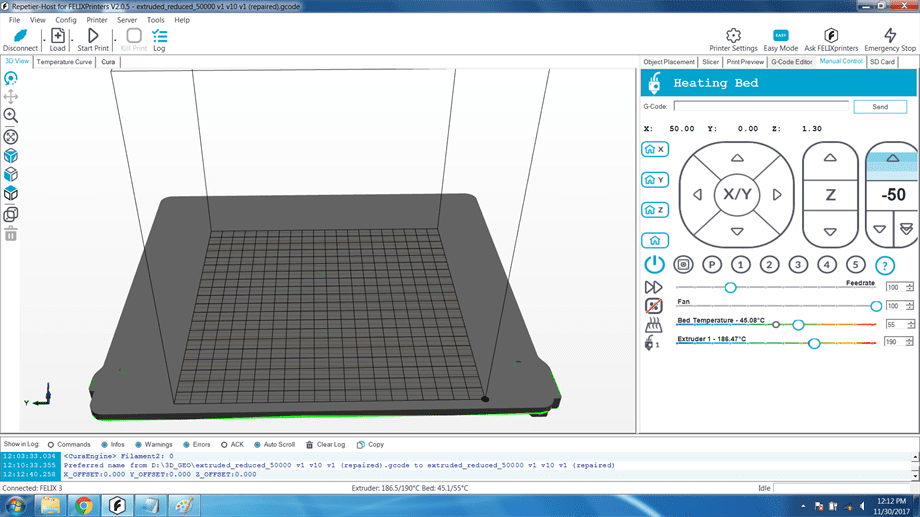
For the printing of our model we will be using the
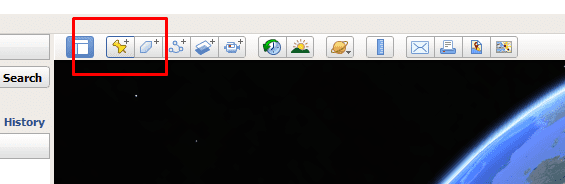
First things first, we need to connect the printer by using the top-left button
.jpg)
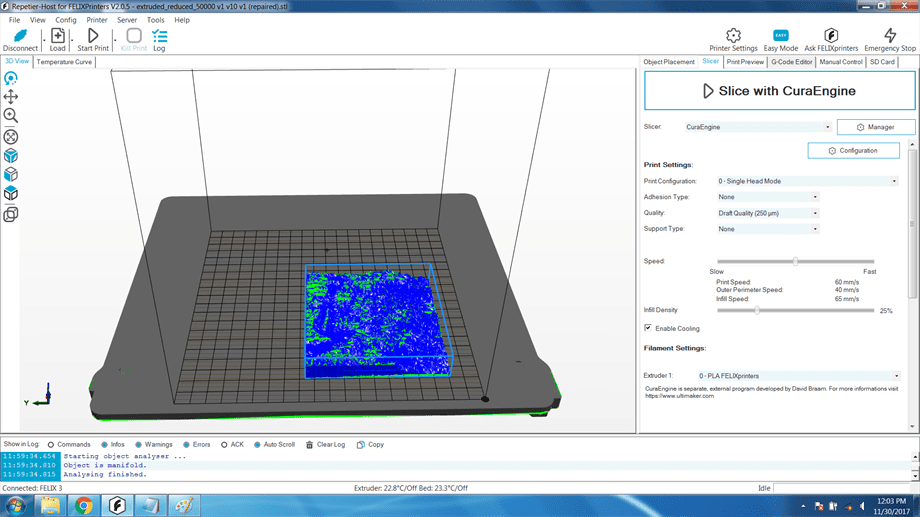
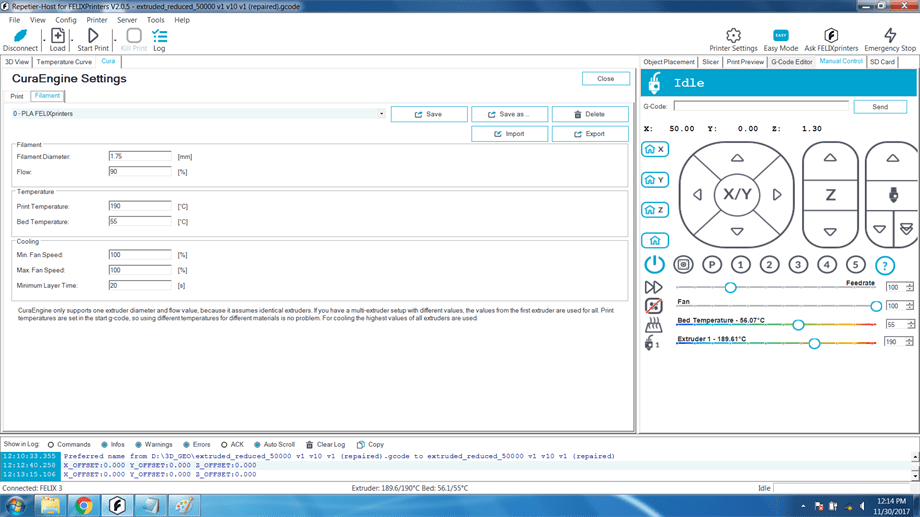
Before slicing the object, we would like to dig into the settings and understand each criterion. For this particular print we choose
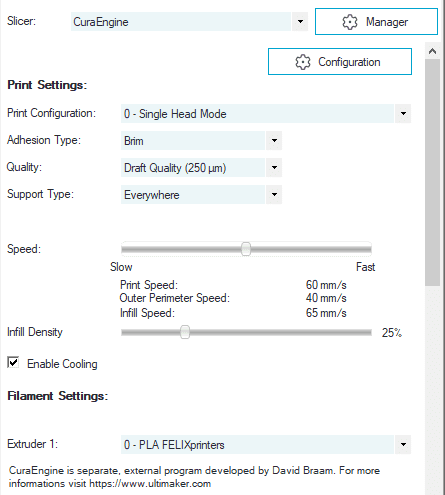
We continue by going into
In the
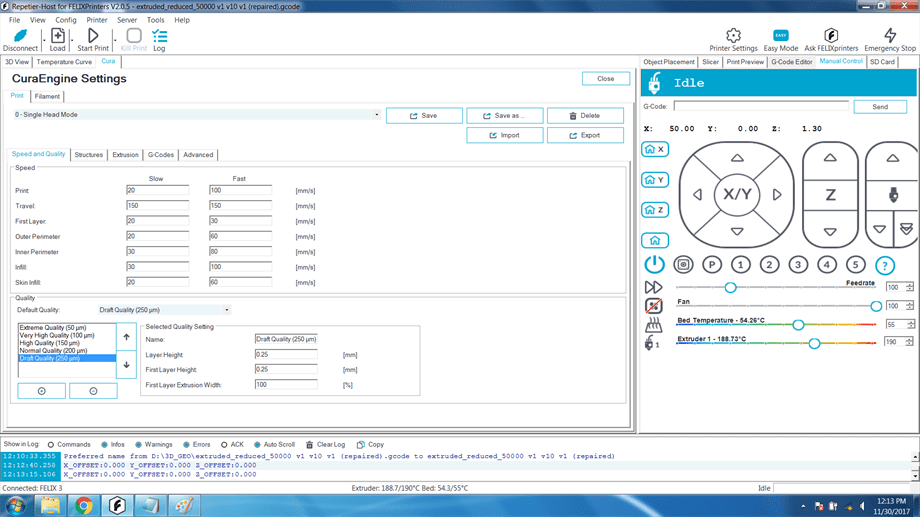
In the
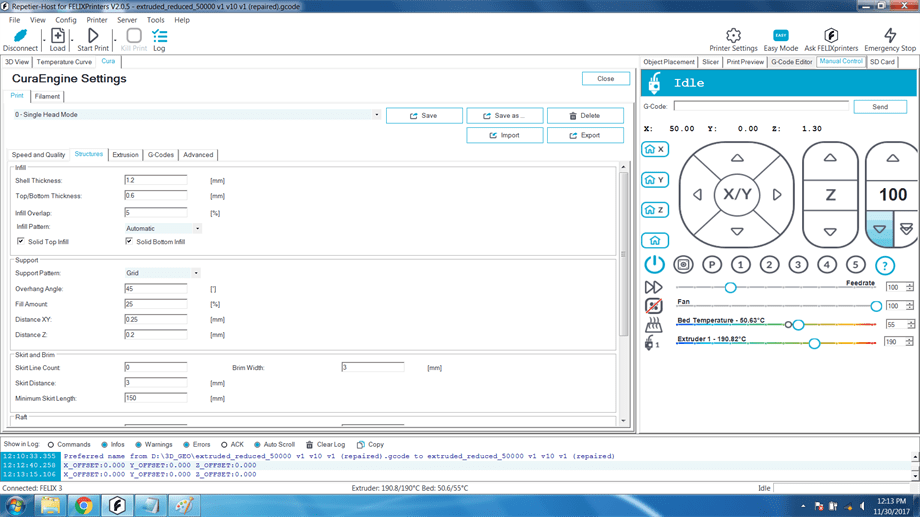
For the
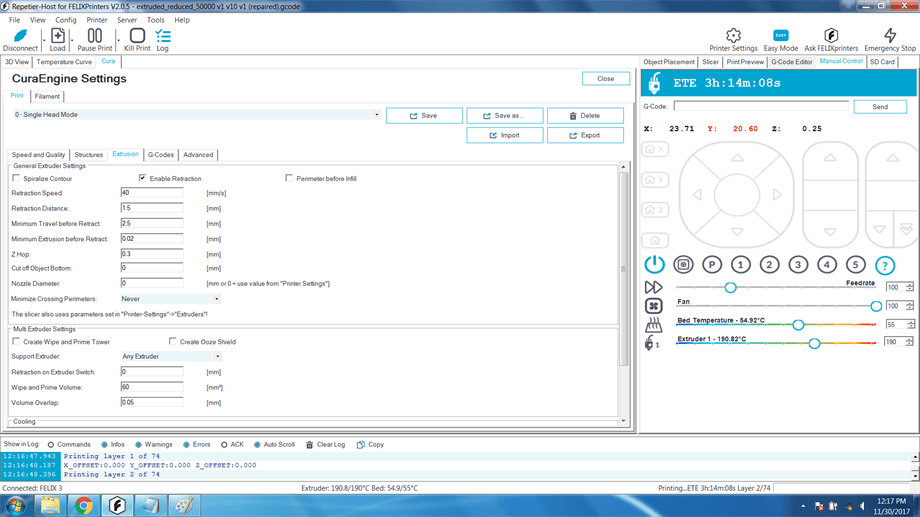
The
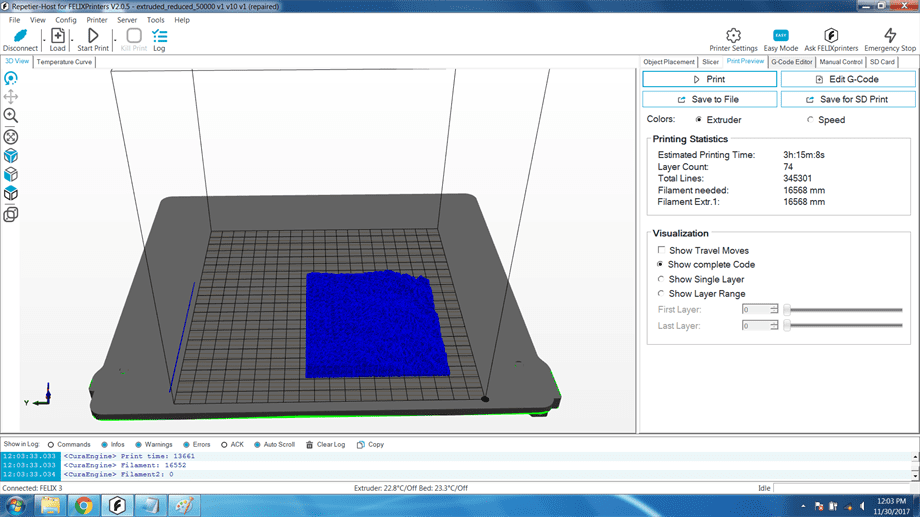
We can go ahead and slice our object, by pressing the
Modifying the G-Code to Change the Material.
Since we have the information at which heights the material needs to be changed, we can go and dig into the
Now we take each previous recorded height and will divided this value by .25 mm. For example, the first heaight is
We will go into the
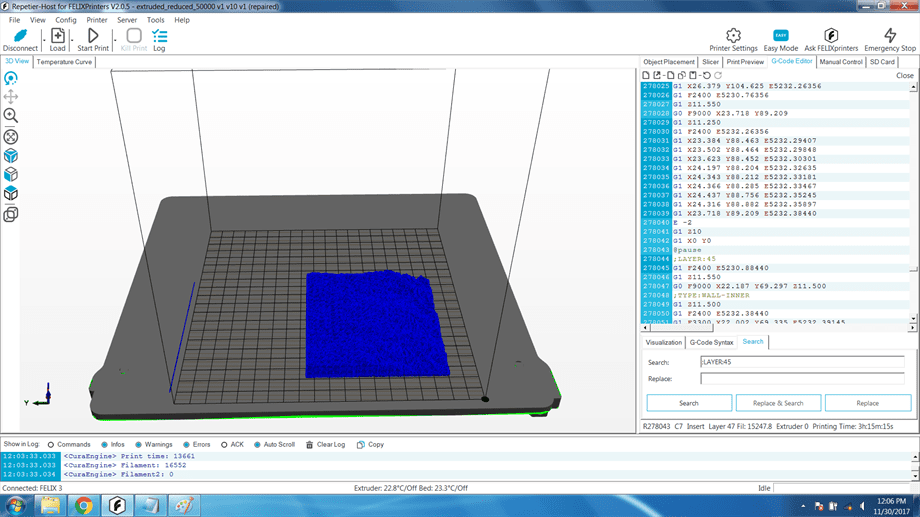
Now just above each line we will insert this G-Code:
E -2
G1 Z18.000
G1 X0 Y0
@pause
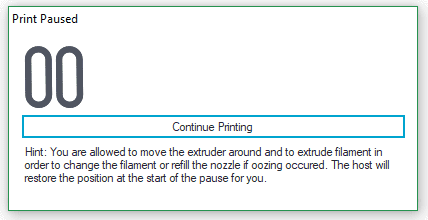
At this moment we should exchange the material. Going into the
Important is to
Now we are ready to print by hitting the
Printing of the Everest.

Finished print of the first layer.
.jpg)
Time to change the filament to green and continuing the print.
... and the second layer.
.jpg)
Repeat unitl all layers are finished.
Finished print of the third layer.
.jpg)
... here goes the fourth.
.jpg)
Finaly, the peaks!
.jpg)
Aftermath.
Printing a geographical area would be much easie if the 3D objects were already out there, however making a 3D object for a specific geographical placement takes time, understanding and attention to details especially when it comes to printing in different colors.
The end result surpassed the expectations. Besides learning how to operate the 3D printer, it's different parameters, by printing the Himalayan Mountains in different colors I also learned how to navigate my way through a complex project, test printing using different colors and get the result done despite multiple trials which were time consuming but good lessons nonetheless.
The peaks of Himalayan Mountains scaled down and at our exposure. Who can tell the difference from the original mountains?
.jpg)
.jpg)
Download Files:
Concept: 3D Scan.
For this assignment, the goals was to create a 3D model of a realistic object, using a 3D scanner. The scanning object results by means of a camera that can capture the reality in 2D. Using a series of algorithms and post-processing, as well as accelerometer sensors, the image is processed into a 3D model. High accuracy results in higher resolution camera, as well as some critycal techniques that can either bounce the light correctly onto the camera or perhaps other input devices are used.
In our case, a scanning application embedded onto the iPad is used to deliver the results.
Producing the Scan.
As a use case, I picked a previously 3D printed object, which was printed with high accuracy. Knowing that a model printed, then scanned, then printed again results in deterioration due to noise, processing techniques, limitations of the camera, that triggered the curioesity to find out how worse can it go?
For the first attempts the object was placed onto the chair, which resulted in scanning the object together with the chair.
.jpg)
.jpg)
In order to fix this problem, I placed the object onto better lighting. A white surfaced table worked much better than the previous attempt, as of previous time the background objects and poor lighting were bouncing of the focus onto the target.
.jpg)
.jpg)
The scan is produced by rotating together with the scanner arround the object which is steadily positioned on the surface. Prior to the scan, a surface area is selected within which the object should fit. This is how the software recognizes that other objects are not of priority.
As a result, the scan is fully produced.
.jpg)
Here is a snapshot of what the software produced as 2D captures of the 3D model.